


Summary
Taking calcium channel blockers may affect the QTc interval. QTc results significantly depend on the formula based on which it is evaluated. Automatic electrocardiogram analysis is possible, but the results should be monitored for errors.
Introduction
One of the most popular tests of the heart is the electrocardiogram (ECG) [1]. The physical basis of this study has been known for over 200 years. The first human ECG studies were carried out in the 1880s [2]. Over time, the way an ECG is performed and the interpretation of the obtained results have undergone considerable evolution. Currently, there are devices with many different leads, from which it is possible to observe the electrical work of the heart cells and verify the correctness of this work. In addition to abnormalities in work and/or localization of the sources of electrical impulses, abnormalities in the structure and course of the conduction pathways of these impulses, an ECG test may suggest or directly diagnose problems such as ischemia of the heart muscle or electrolyte disturbances that have a significant impact on the work of muscles, including cardiac muscle disease. Furthermore, it can also contribute important information in diagnosing many congenital or acquired conditions, which over time have clinical manifestations in very different ways – from non-specific ailments in the chest, neck, and dizziness to loss of consciousness, often accompanied by life-threatening cardiac arrhythmias.
The wide use of ECG records in the diagnosis of many different diseases, combined with the developing technical capabilities, means that more and more often, ECG monitors are used for continuous, even several days’ recording, from many different leads, both with the use of implantable devices and external recorders. Such long measurements enable the registration and diagnosis of disorders that are not always visible during a standard examination, occurring sporadically every few days or less frequently, but at the same time pose a real threat to the patient’s life or health, or are simply burdensome and significantly limit his activity. Furthermore, the obtained ECG trace must be correctly labelled. The time to prepare the description increases in proportion to the quantity of collected data. This situation is a significant limitation of the developing methods, and there is a need to support people who interpret this type of provision. Hence, for years, it was necessary to automate the processes of describing ECG curves and to automatically search for irregularities so that the descriptor could describe and interpret a record lasting several days in a few minutes. Unfortunately, each algorithm has some limitations, but the doctor’s support, e.g., by showing those fragments of the record that deviate from the norm or contain predefined abnormalities, allows the diagnostic process to be shortened significantly. Therefore, developing various types of algorithms supporting the work of people describing and interpreting ECG records becomes an essential element in the development of cardiological diagnostics.
An essential parameter in the recording of the electrocardiograph is the QT interval. It is the image of the total duration of depolarization and repolarization of the ventricular muscle. As it can vary from lead to lead, it is measured in the lead with the longest QT interval. The heart rate is the most crucial variable influencing the interval’s size. Therefore the result is often adjusted for its value. There are four well-known formulas by which we can calculate the corrected QTc interval [3, 4]. The first one is Bazett’s formula (1), the second is called Fridericia’s formula (2), the third is the Framingham formula (3), and the fourth is Hodges’s formula (4).
Bazett’s formula [5]: ,
where: QTc1 – the corrected QTc segment according to Bazett, QT – the measured QT segment [s], RR – the interval between R waves [s].
Fridericia’s formula [6]:
where: QTc2 – the corrected QTc interval according to Fridericia, other symbols as in formula (1).
Framingham formula [4]:
where: QTc3 – the corrected QTc interval according to Framingham, other symbols as in formula (1).
Hodges formula [7]:
where: QTc4 – the corrected QTc interval according to Hodges, other symbols as in formula (1).
The above formulas have been developed for scientific research due to the high dependence of the QT interval on the heart rate, and thus RR intervals. Bazett’s formula is popular, while the Fridericia, Framingham, and Hodges formulas are used less frequently [8].
Normal QTc is assumed to be 0.35 to 0.44 s [9]. The duration of the QT interval is influenced by clinically relevant factors, such as the activity of the autonomic system, the concentration of electrolytes (potassium, magnesium, calcium), medications taken, or human activity. The analysis of the duration of the QT interval is essential because QT prolongation (regardless of the cause) can lead to the development of life-threatening arrhythmias (most often ventricular fibrillation). Short QT syndrome is a sporadic disease, most often congenital, which, like prolonged QT interval, significantly increases the risk of sudden cardiac death caused by arrhythmias. Correct and quick diagnosis of an abnormal QT interval is essential as there are now many treatment options for this patient group. Proper diagnostics in this area may, for example, lead to the implantation of an automatic cardioverter and thus extend the life of a patient at risk of death.
Calcium channel blockers (CCBs) are a heterogeneous group of drugs often used in cardiology to treat diseases such as high blood pressure and arrhythmias. However, they can be divided into two major categories based on their predominant physiologic effects [10]:
– Dihydropyridines, which preferentially block the L-type calcium channels in the vasculature, thanks to which they are used in the treatment of hypertension [11]. Their potential antiarrhythmic effect requires using much higher doses than those effective in treating arterial hypertension. Hence this group of drugs has no effective use in treating cardiac arrhythmias.
– Non-dihydropyridines, which selectively block L-type calcium channels in the myocardium. Blockers from the non-dihydropyridines group are classified as class IVa antiarrhythmic drugs [12] and are used in treating arrhythmias, mainly supraventricular [13].
Literature data on the effect of calcium channel blockers on the QTc interval are not unequivocal. In the case of dihydropyridine blockers, several studies show no effect of these drugs on the QTc interval. At the same time, data from preclinical studies [14] and clinical trials show that these drugs can prolong the QT interval [15].
Regarding calcium channel blockers from the group of non-dihydropyridines, literature data show that these drugs can reduce the QT interval. These data refer to verapamil [16], and studies of diltiazem show that it does not have a significant effect on the QT interval, especially when used in the group of patients with angina [17]. There are also publications showing that diltiazem can prolong the QT interval in a select group of susceptible patients [18].
The study aimed to analyze the ECG recordings regarding the QTc interval in patients taking antiarrhythmic drugs, particularly drugs from the dihydropyridine calcium channel blockers (nifedipine) and non-dihydropyridine blockers (verapamil and diltiazem). The control group consisted of patients not taking calcium channel blockers. The idea of comparing ECG traces between these patient groups arose because different groups of calcium channel blockers have other effects on the heart muscle and vascular system. Moreover, literature data on the impact of calcium channel blockers on the duration of the QTc interval are not unequivocal. The authors attempted to use algorithms whose task was to automatically determine and measure the QT and RR intervals to accelerate and automate the process of analyzing the ECG recording.
Material and methods
Study material
The publicly available PhysioNet signals database [19] was used to analyze the effect of selected drugs on the heart rhythm and QTc interval. Then, the European ST-T Database was chosen from the available detailed databases [20]. This database was created to evaluate the quality of an algorithm that monitors ST and T wave behavior during tests carried out in 1985.
ECG analysis
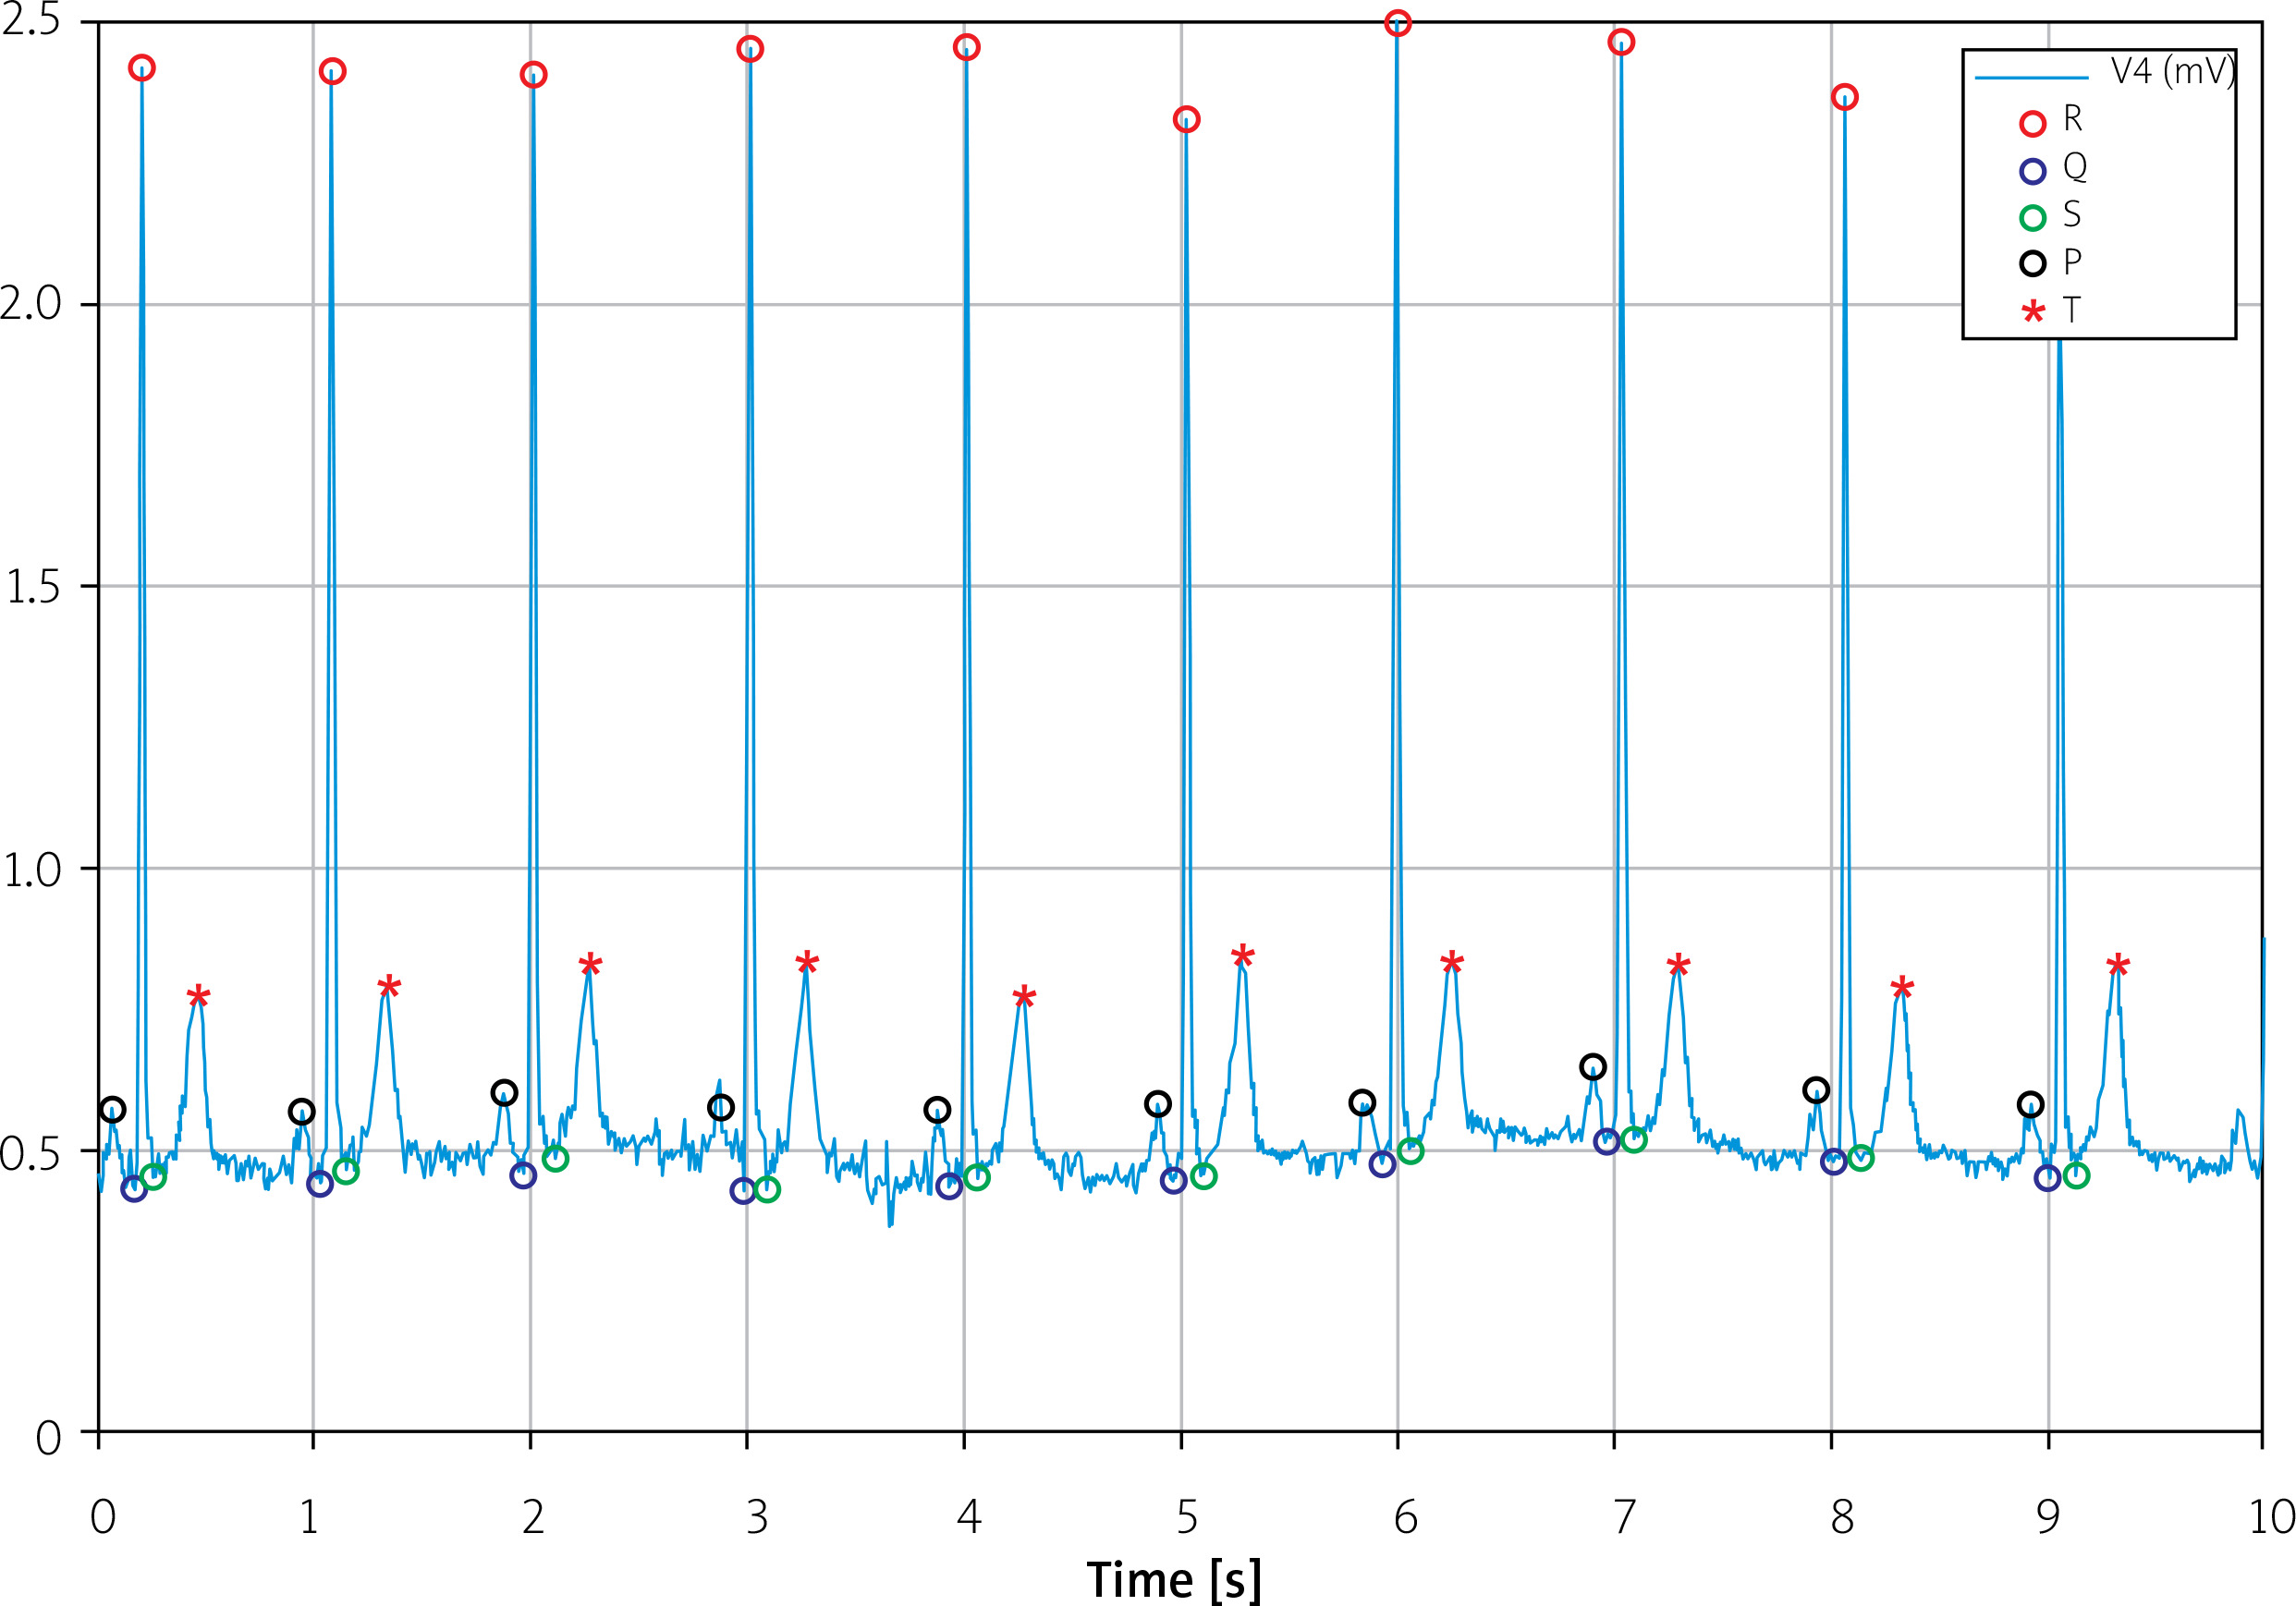
Data from the PhysioNet database were entered into MATLAB (version R2021a, The MathWorks, Inc.). To read the signal correctly, it was necessary to read the frequency at which the values were collected and then superimpose them on the time axis. When the program displayed the command, a signal resembling an ECG was displayed. Two signals from two different leads were available for each patient. Some calculations were made to properly read the received record, which helped to determine all the waves. First, the program searched for the maximum values of the signal at appropriate distances from each other and recorded the area between them. In this way, the signal was divided into many parts, each of which was a schematic recording of the ECG with each wave and interval. To determine each of the waves in a given area, subsequent steps were taken, such as determining the local maximum and minimum values, marking the maximum values as R waves, and marking the remaining waves, taking into account their position in relation to the R wave. After starting the program, the graph shown in Figure 1 was obtained.
The created program had trouble analyzing each signal because it wasn’t universal enough. With many signals, disturbances appeared, which could be related to the undulating isoelectric axis, irregularities in the heart rhythm or curve changes for different leads, defective characteristics of the apparatus, or technically inappropriate movement of the recording, during which, for example, the electrode detached or the patient moved during the examination. As the program did not work correctly for all signals, some of the data were collected “by hand” by reading the corresponding write values that could not be correctly read with the program.
Statistical analysIs
Categorical variables are presented as numbers and percentages. Continuous variables were expressed as mean, standard deviation (SD) or median, minimum, maximum, and interquartile range. Differences between groups for continuous variables were compared using Student’s t-test and the Wilcoxon test – the results of both tests are presented. Pearson’s χ2 test compared categorical variables. The results of the individual formulas for estimating the QTc value were compared using a paired, two-sided t-test.
Two-sided p-values < 0.05 were considered statistically significant. All calculations were done with JMP, Version 16.1.0 (SAS Institute Inc.).
Results
The European ST-T Database was selected from the available PhysioNet signals databases for the study purposes. This database contains 90 ECG tests. Each test has a two-lead ECG. The database included patients diagnosed with myocardial infarction, often also with concomitant diseases such as arterial hypertension and coronary artery disease. Based on available drug data, the database contains:
– 18 ECG recordings of patients taking dihydropyridine calcium channel blockers (nifedipine). For further analysis, this group is called DHP;
– 22 ECG recordings of patients taking non-dihydropyridine calcium channel blockers (verapamil and diltiazem). This group is called n-DHP;
– 50 records of patients not taking calcium channel blockers; this group, for the study, is a Control group.
Based on the four formulas described above, the QTc interval was determined for all records stored in the database. Then, following the adopted methodology of QTc determination [21], one lead with a higher QTc value was selected for further analysis of each record. The most frequently analyzed leads are V4 (29%), V5 (24%) and III (19%). Such a choice was possible for each record – in each case, it was possible to choose one lead for which the measured QTc was greater, regardless of the measurement’s formula.
The QTc values obtained using particular formulas are presented in Table I. Analyzing the given values, it can be observed that the lowest QTc values were obtained using the Bazett formula, the values obtained based on Fridericia and Framingham formulas were very similar, and slightly higher values were obtained based on the Hodges formula. However, comparing the obtained results with the paired, two-sided t-test, the observed differences turned out to be statistically significant in most cases (Bazett vs. Fridericia – p < 0.0001; Bazett vs. Framingham – p = 0.0002; Bazett vs. Hodges – p < 0.0001; Framingham vs. Hodges – p = 0.0444). Only the differences between the values obtained using the Fridericia formula vs. Framingham and Fridericia vs. Hodges were non-significant.
Table I
QTc values for the selected formulas
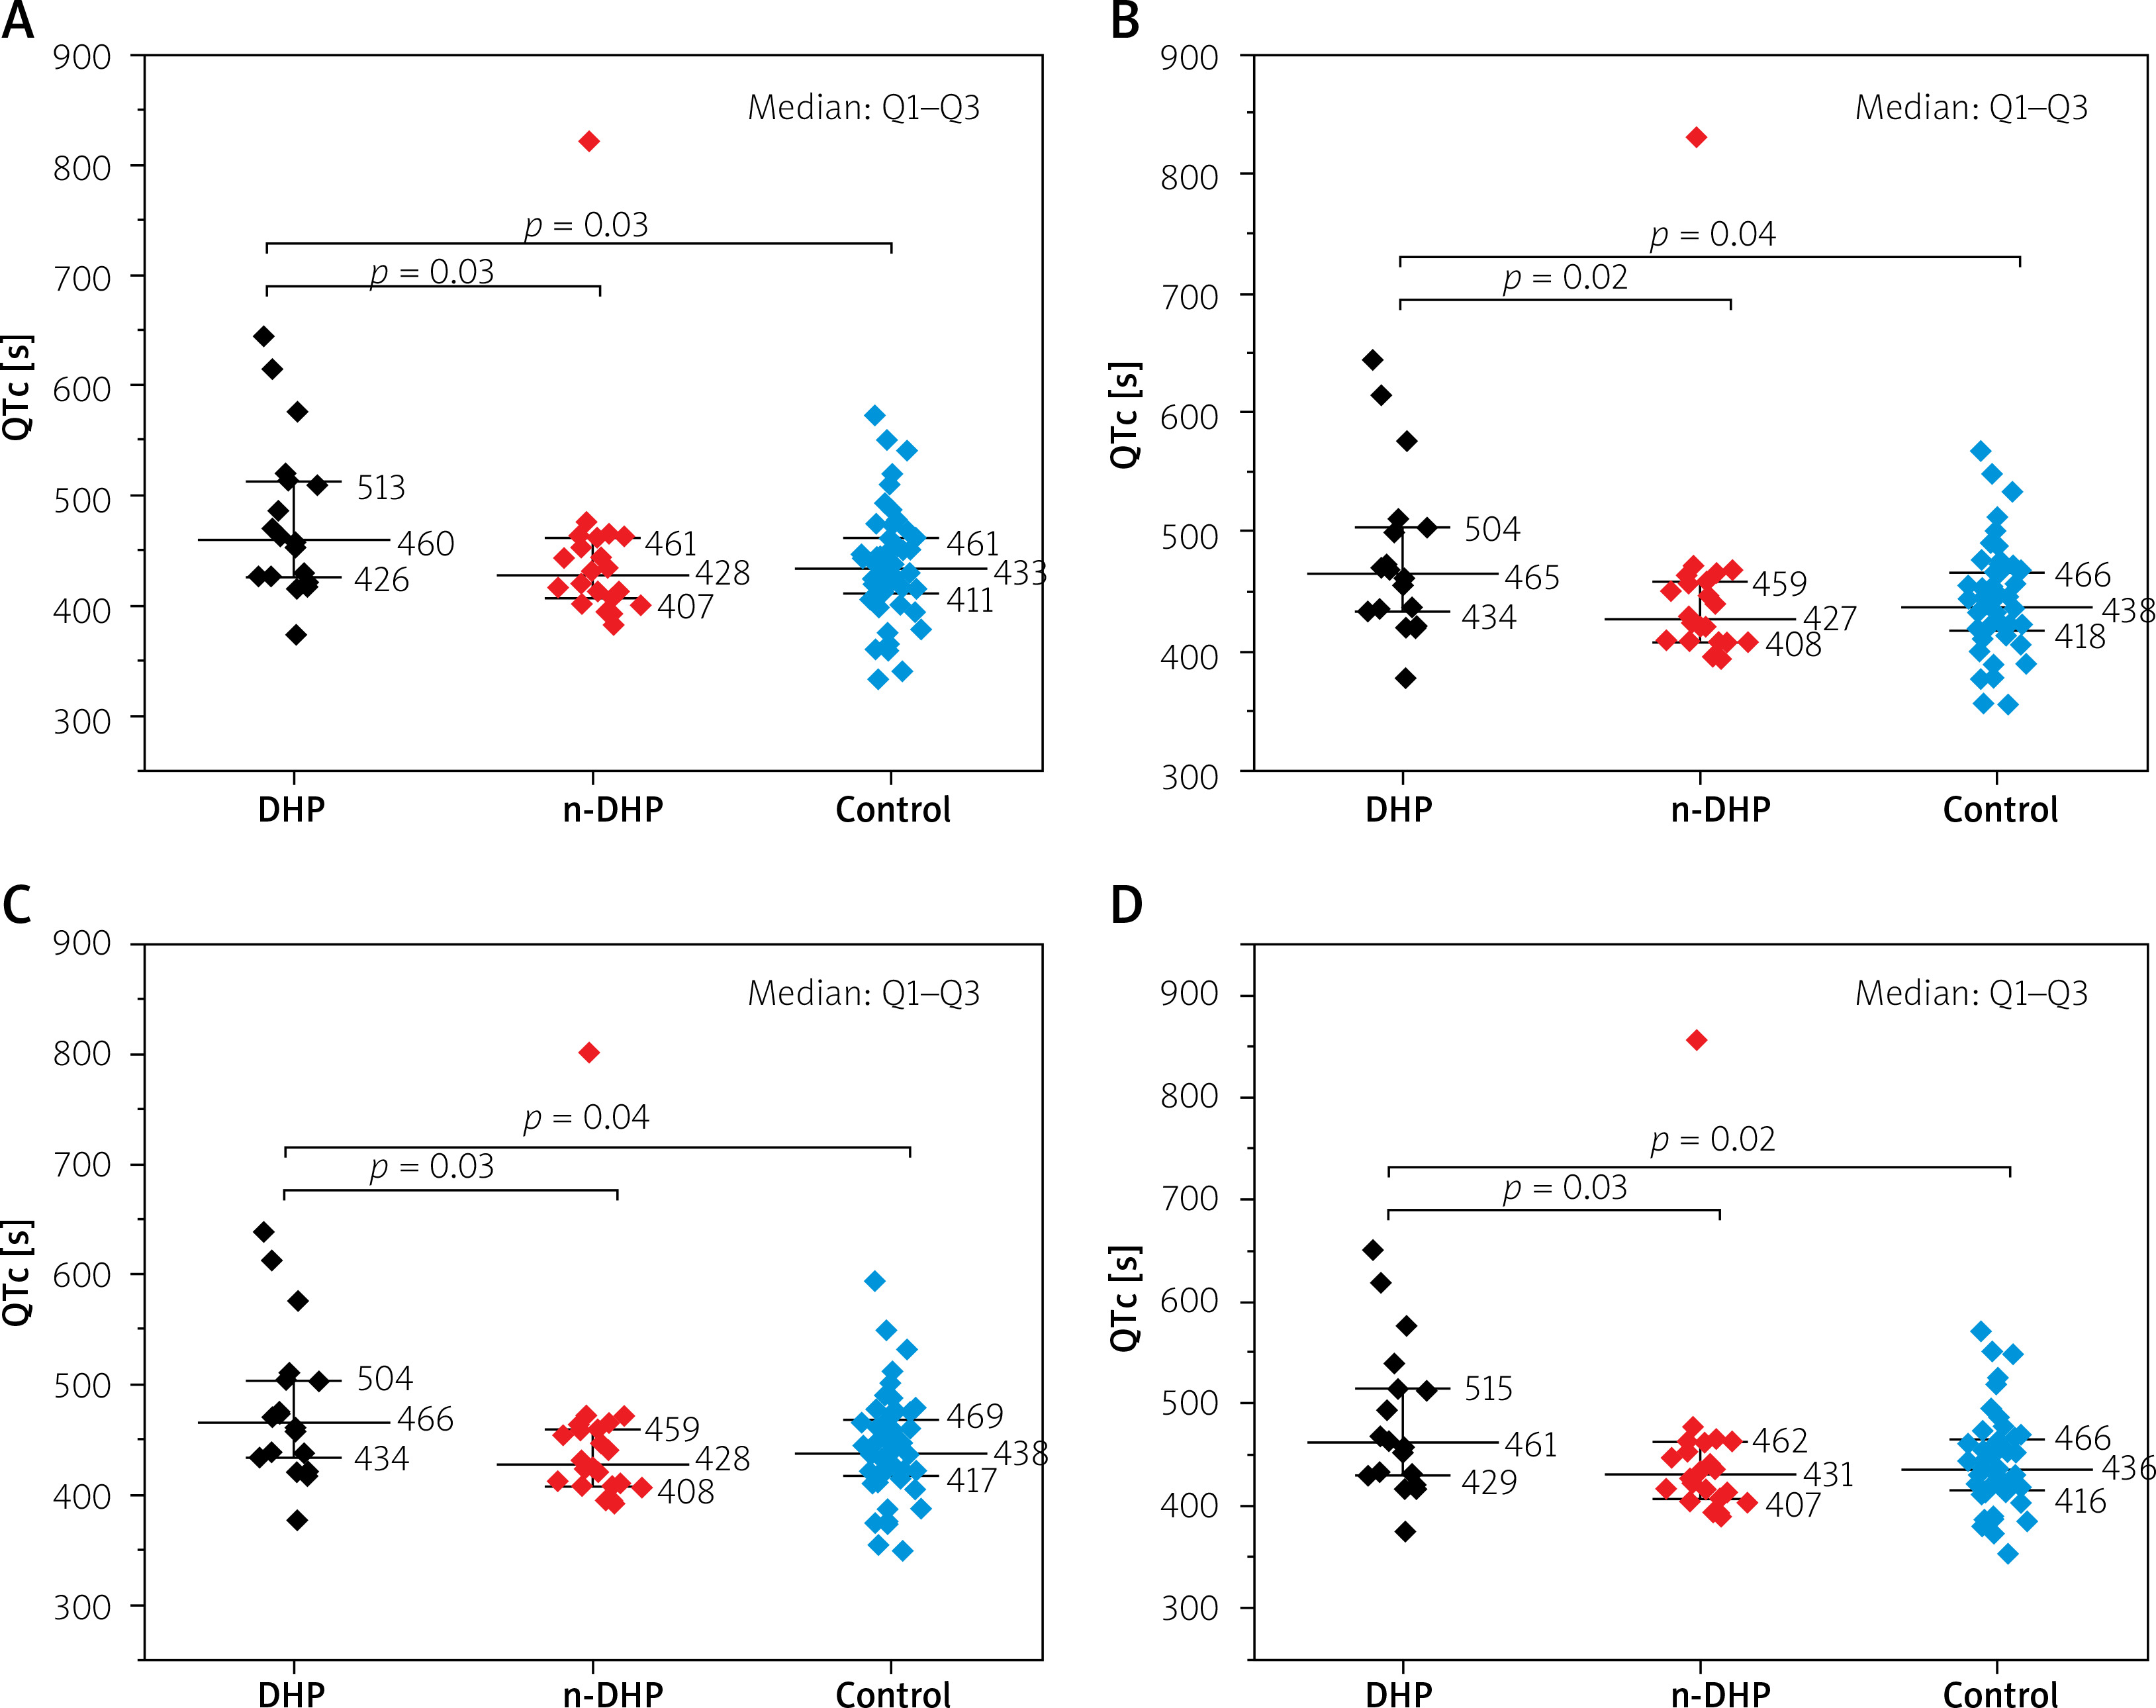
In the further part of the analysis, the QTc values between the initially defined study groups were compared, treating QTc as a continuous variable. The obtained QTc values in the DHP group turned out to be significantly higher compared to the n-DHP group (non-parametric comparison of medians) and in the control group. However, there were no significant differences between the n-DHP and control groups. The distribution of QTc in individual study groups is illustrated in Figure 2 (panel A – Bazett formula, panel B – Framingham formula, panel C – Fridericia formula and panel D – Hodges formula).
Figure 2
QTc distribution in study groups (A – Bazett formula, B – Framingham formula, C – Fridericia formula, D – Hodges formula)
The clinical significance of QTc is based mainly on assessing whether the estimated interval is within the normal range or abnormal. Our database includes records in which QTc exceeds the adopted norm. Therefore an analysis of the distribution of QTc in individual groups was performed, treating this parameter as a binary variable – QTc in the norm (N) or extended QTc (L). 450 ms for men and 460 ms for women were assumed as the upper limit of normal QTc values [22]. Three of the four QTc formulas observed significantly more frequent occurrence of prolonged QTc intervals in the DHP group compared to the control group.
In contrast, two formulas identified more frequent occurrence of prolonged QTc interval in the DHP group compared to the n-DHP group. However, there were no significant differences in the incidence of prolonged QTc interval when comparing the n-DHP group with the control group. The obtained results are presented in Table II.
Table II
QTc comparison between study group – binary variable
Discussion
The present study shows that automatic analysis of the ECG recording in terms of the QTc parameter is possible. Furthermore, we can use virtually any formula that estimates this parameter in its scope. Therefore, it is possible to use such analysis for scientific or clinical purposes. From a clinical point of view, the present results show that in the group of patients receiving calcium channel blockers from the group of non-dihydropyridines, the distribution of the QTc interval analyzed as a continuous as well as binary (normal vs. prolonged) variable is similar. On the one hand, these observations are consistent with the published data mentioned by the authors in the introduction [18], as the analyzed group of patients consists of patients diagnosed with angina. On the other hand, there was no tendency for more frequent prolonged QTc interval in the n-DHP group, although there are publications describing this phenomenon [19].
In the group of patients taking calcium channel blockers from the dihydropyridine group, in the analyzed population, it was nifedipine. We often observe a prolonged QTc interval – assessed as a continuous and a binary variable. Literature data, which mainly concern amlodipine, usually do not show a significant effect on the QT interval in patients taking this drug [23–25]. However, publications indicate the possibility of a prolonged QT interval in patients taking calcium blockers from the dihydropyridine group [16]. The present data may confirm such observations.
Taking into account the observed differences between the results of the QTc assessment with the use of different formulas, we can observe that using the Bazett formula, the obtained results are significantly lower than in the case of using the other three formulas. This is an important finding because the Bazett formula seems to be one of the primary and frequently used formulas for assessing the corrected QT interval. However, the absolute differences between the obtained results may not be very high, although in the case of the QTc cut-off values and the assumption of the same norms, regardless of the QTc assessment method used, the diagnosis of a long QTc may depend on the formula used. For this reason, reports of slightly different QTc upper limits of normal values depend on the method of assessing this parameter [26].
Limitations: This work, however, has some limitations, resulting from the fact that we do not know what the medical history of patients is, including what the ECG looked like before the introduction of the drug. Furthermore, we do not have records of 12 leads. Therefore, we do not influence the technical quality of the ECG and we do not know the doses and duration of antiarrhythmic drugs taken by the patients whose ECG records we analyze. Moreover, in the presented analyses, we cannot directly assess the influence of the drugs used on the QTc value due to the limitations mentioned above. Therefore, this indirect assessment analyzes ECG records while taking the medication.
Conclusions
Automatic ECG analysis is possible. However, it should be used carefully, considering the possibility of obtaining incorrect results in a situation where the algorithm is applied to a recording for which it has not been correctly defined and validated. For example, automatic analysis of the duration of the QT interval allowed us to identify groups in which a significantly longer QT interval was observed.
Although the literature does not provide information on the significant effect of calcium channel blockers on the duration of the QT interval, our analyses show that in the group of patients taking dihydropyridine blockers, this interval could be significantly longer than in patients taking non-dihydropyridine blockers and in patients not taking calcium channel blockers.
QTc results significantly depend on the formula based on which we evaluate this parameter, so it is worth paying attention to the correct range of QTc values, which differs depending on the selected method of assessing this parameter.