Biology of Sport
eISSN: 2083-1862
ISSN: 0860-021X
Biology of Sport
Current Issue Manuscripts accepted About the journal Editorial board Abstracting and indexing Archive Ethical standards and procedures Contact Instructions for authors Journal's Reviewers Special Information
Editorial System
Submit your Manuscript
SCImago Journal & Country Rank
4/2023
vol. 40
 
Share:
Share:
Original paper

Eccentric hamstring strength in young athletes is best documented when normalised to body mass: A cross-sectional study with normative data of 590 athletes from different age categories

Evan Jeanguyot
1, 2, 3
,
Benjamin Salcinovic
2, 3
,
Amanda Johnson
4
,
Nicol van Dyk
5, 6, 7, 8
,
Rod Whiteley
3, 9

  1. NSW Institute of Sport, Sydney, Australia
  2. Aspire Academy Sports Medicine Center, Aspire Academy, Doha, Qatar
  3. Rehabilitation Department, Aspetar Sports Medicine Hospital, Doha, Qatar
  4. Manchester Metropolitan University, Manchester, United Kingdom
  5. Aspetar Orthopaedic and Sports Medicine Hospital, Doha Qatar
  6. High Performance Unit, Irish Rugby Football Union, Dublin, Ireland
  7. Section Sports Medicine, Faculty of Health Sciences, University of Pretoria, Pretoria, South Africa
  8. School of Public Health, Physiotherapy and Sport Sciences, University College Dublin, Dublin, Ireland
  9. School of Human Movement & Nutrition Sciences, The University of Queensland, Australia
Biol Sport. 2023;40(4):1079–1095
Online publish date: 2023/03/21
Article file
- 13_02864_Article_c.pdf  [3.38 MB]
Get citation
 
PlumX metrics:
 

INTRODUCTION

Adolescents undergo a period of rapid growth and development which makes assessment of training-related changes in parameters such as strength difficult to tease out from these normal processes. Between-athlete comparisons are confounded by variations in timing of growth spurts in addition to the longitudinal-within individual differences. Normative eccentric hamstring strength in adult populations has been extensively explored and its association with injury risk mitigation well established [1]. Eccentric hamstring strengthening in youth has been suggested to develop physical qualities of sporting performance as well as reduce injury risk [2]. Further, given that athletic movements for performance in youth mimic their adult counterparts such as deceleration, landing and hopping, exposure to eccentric resistance training is warranted [2]. While its role in injury risk mitigation is well established in adult populations [1], its role in athletic youth populations is not well described. This may in part be due to a lack of normative data for practitioners to base their preparation and intervention decisions on. Understanding any relationships between these strength values and players’ chronological age, and skeletal age (for student athletes) as well as body mass will better inform the interpretation of these tests.

The interactions between growth, maturation, and eccentric hamstring muscle strength in football and athletic youth populations are yet to be fully established. Further, a comprehensive overview assessing eccentric hamstring strength between elite footballers and elite youth athletes is yet to be explored. The inherent complexity and non-linearity of youth athletes’ normal physical growth, biological maturation, and behavioural development make it difficult to gauge a true representation of their abilities at any given moment [3]. These complex interactions need to be considered when assessing eccentric hamstring strength at a single time point, or when comparing different measures over time. To better understand the effectiveness of training interventions, any improvements in strength which are attributable to these training effects need to be teased out from those due to physical growth and maturation. [1, 2]

This paper aims to describe normative values of eccentric hamstring strength in well-trained male athletic and football youth populations. Secondly, it aims to describe any relationships between eccentric hamstring strength and body mass, skeletal maturation status, and chronological age. Finally, these data are compared with a sample of professional adult male football players.

MATERIALS AND METHODS

Study design and participants

Student athletes

A cross-sectional cohort study design described growth, maturation, and knee flexor strength prospectively over three seasons. The participants were male full-time student athletes, enrolled in the football, athletics or multi-sports programmes at Aspire Academy, an elite sporting academy in the Doha, Qatar. Testing was completed during the preseason or initial competitive cycle of the 2016/17, 2017/18 and 2018/19 seasons (Figure 1).

FIG. 1

Flow chart demonstrating the movement of players and repeated measurements during three seasons, 2016–17 to 2018–19 and body mass (kg) for highly trained athletes in sports academy.

/f/fulltexts/BS/50251/JBS-40-50251-g001_min.jpg

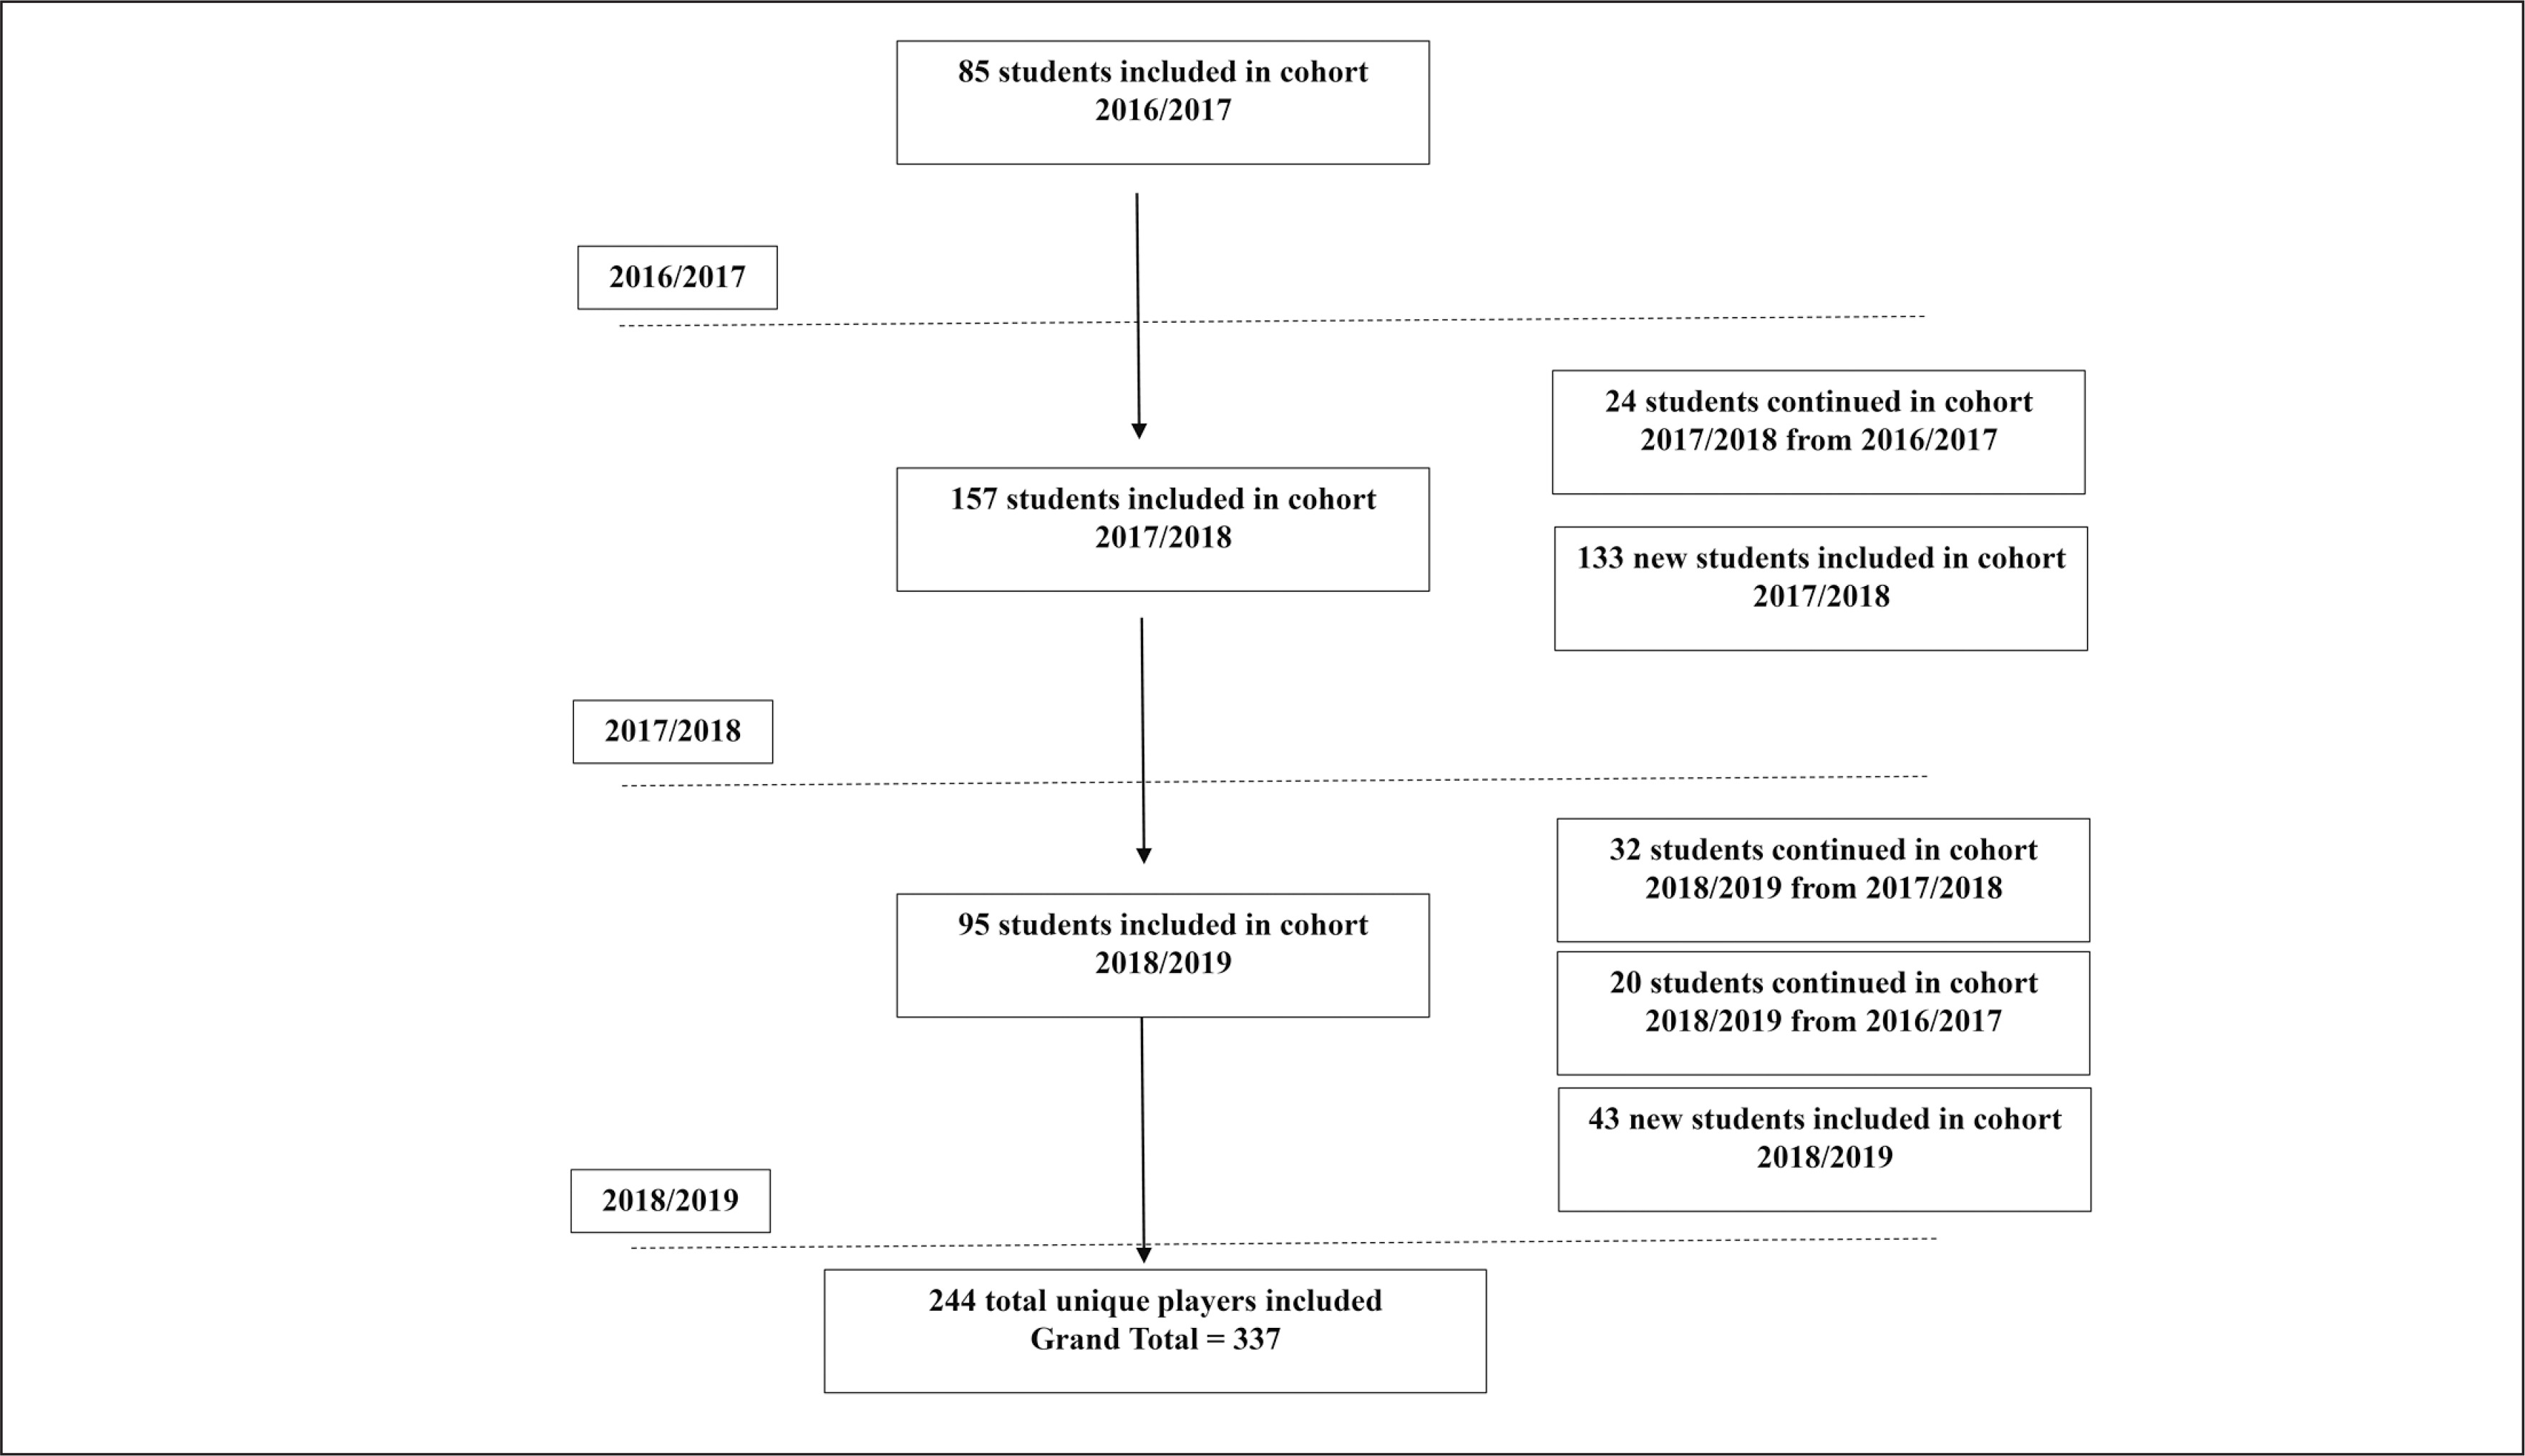
A total of 330 male athletes (chronological mean age 15.3 ± 1.7, height 169 ± 11, weight 58.8 ± 14.2, BMI 20.3 ± 3.3) presented for screening across three seasons from 2016 to 2019. The demographic data for this cohort are summarised in Table 1. There were 313 body mass measurements and 306 complete skeletal age measures conducted at the time of eccentric hamstring testing assessments. All athletes needed to be free of injury to the lower limbs and able to participate fully in training at the time of testing.

TABLE 1

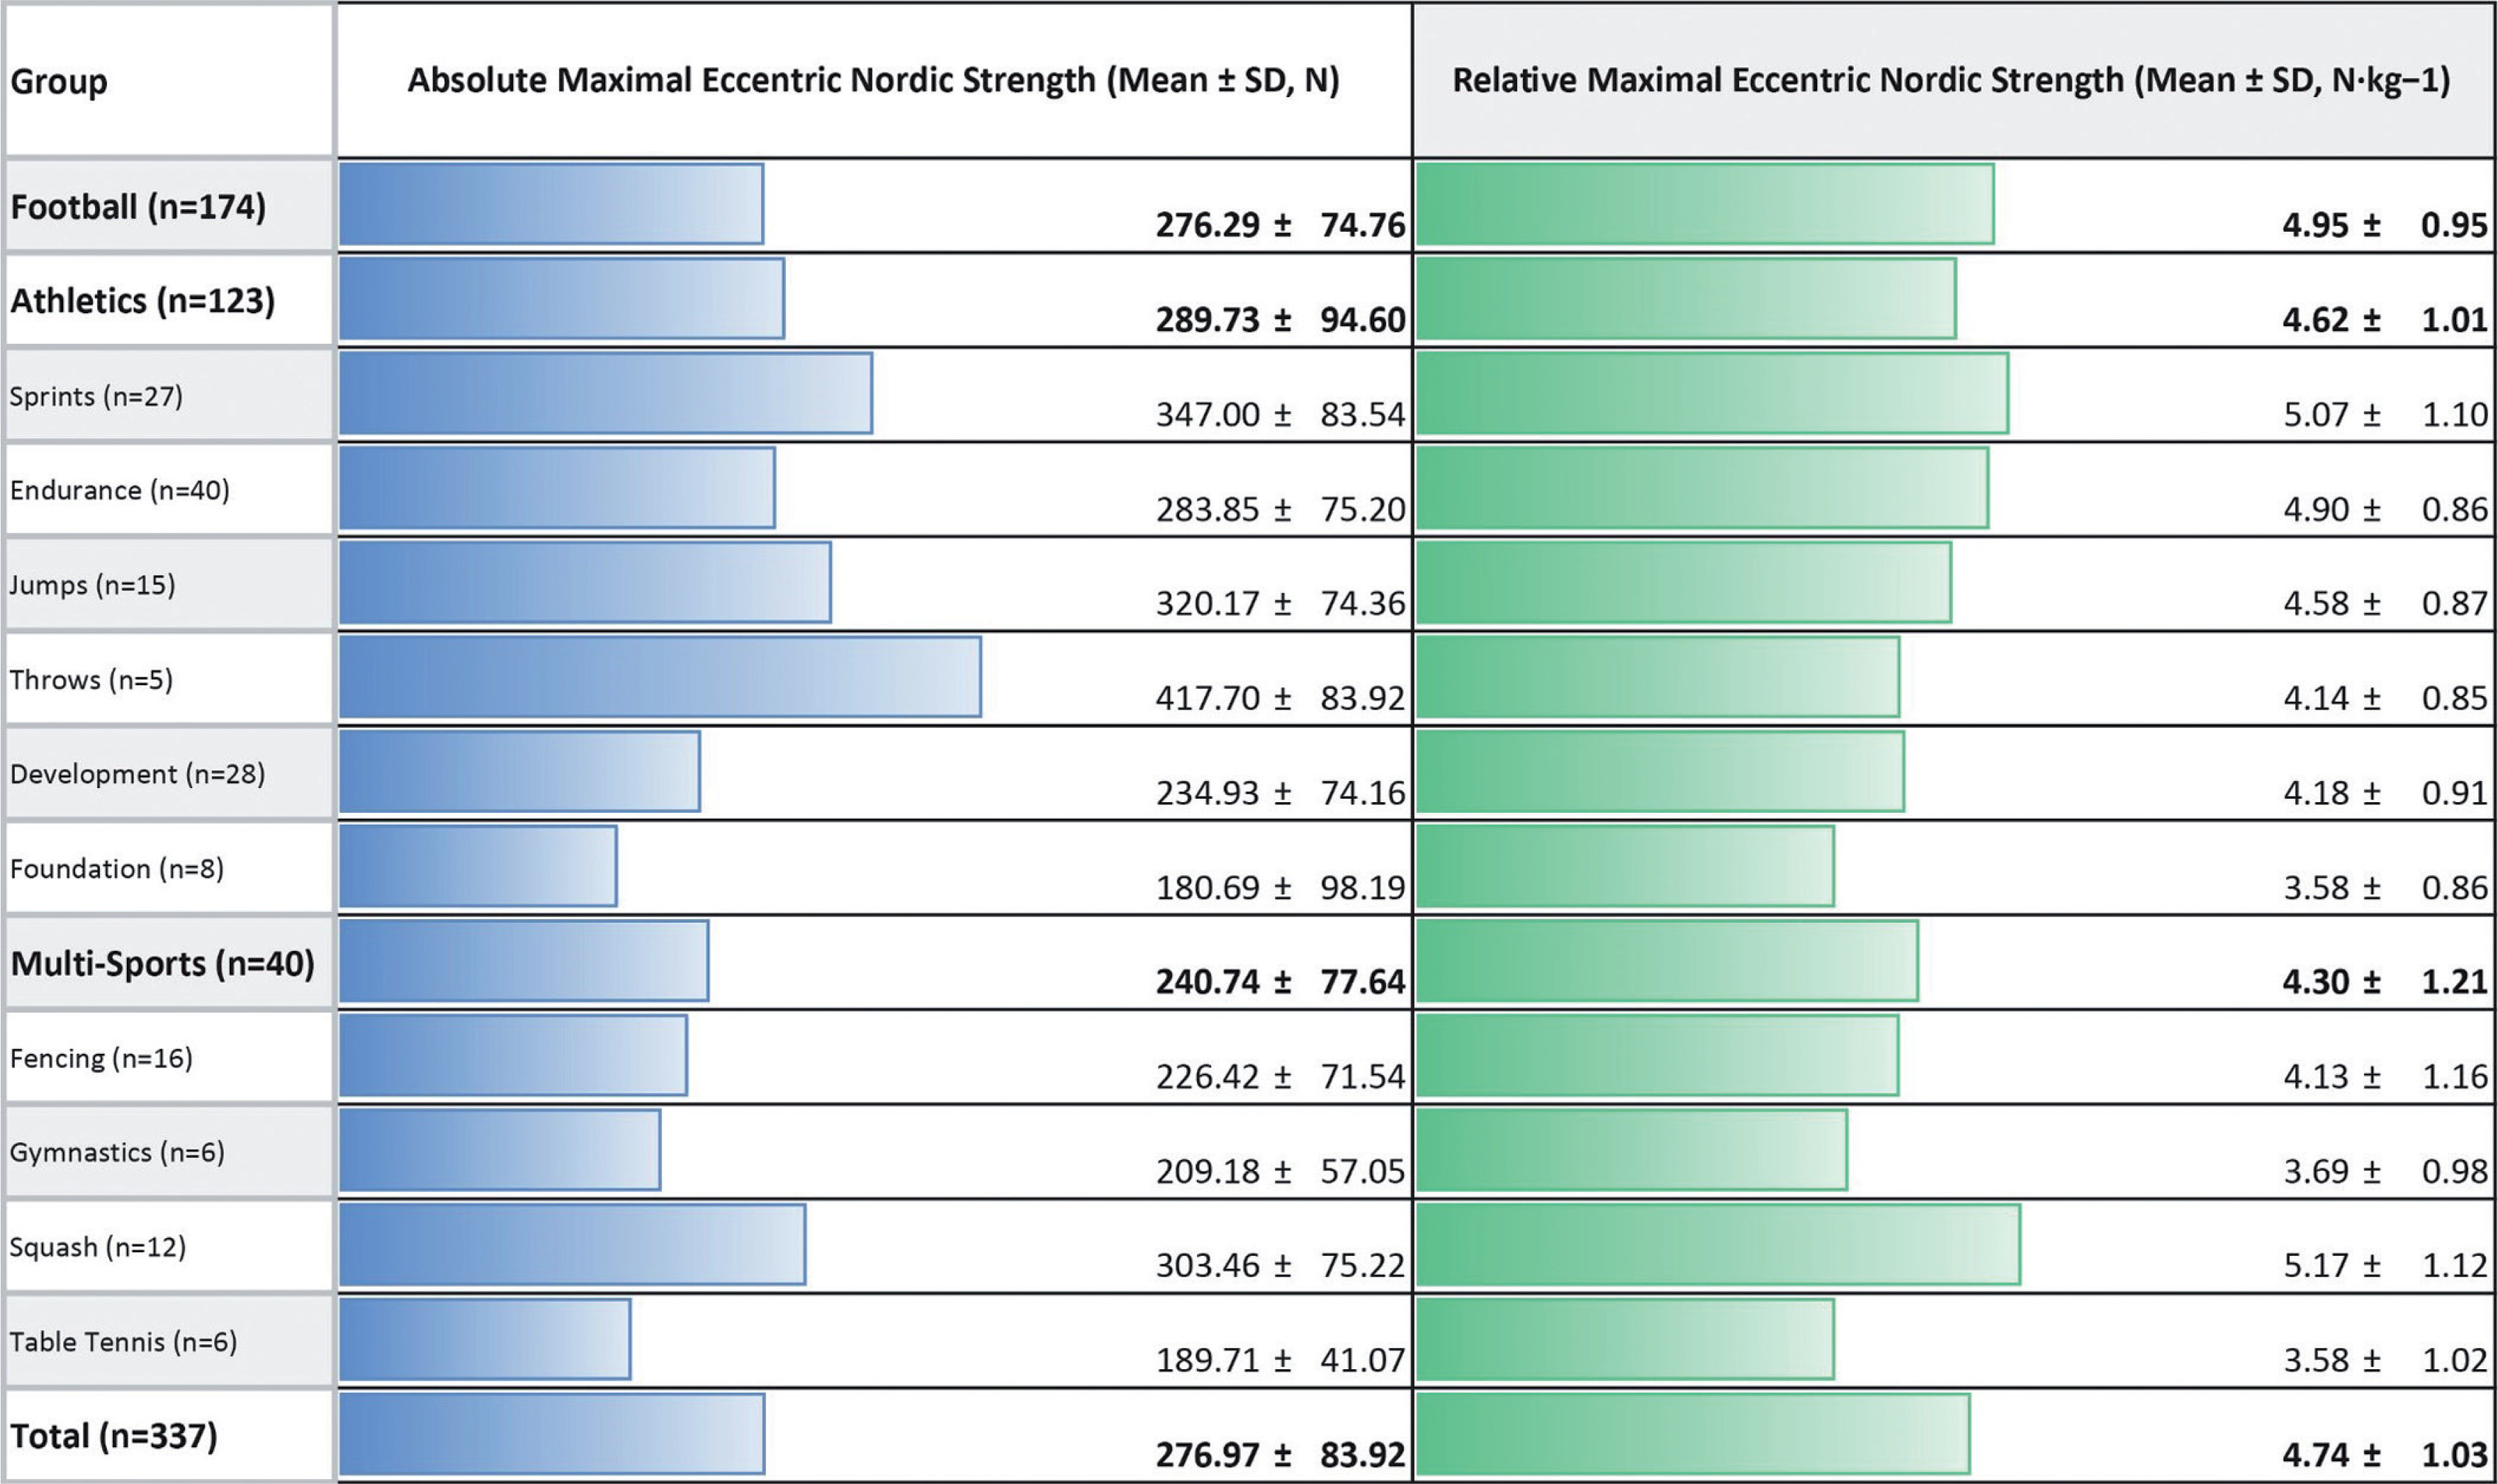
Participant characteristics. Student athletes compete in age categories “U13” to “U20” – Under 13 years of age at the start of the academic year to under 20 years of age respectively. Of these student athletes, 174 played football, 119 competed in athletics, and 46 in multi-sport events. The QSL Adult cohort is the professional football players included in pre-competition medical assessment. Data are presented as mean ± SD. Skeletal age is assessed using the FELS method. No skeletal age data are available for the adult QSL athletes.

Age GroupChronological Age (Years)Skeletal Age (Years)Height (cm)Weight (kg)Body Mass Index (kg/m²)
Student athletes (n = 330)15.2 ± 1.716.1 ± 2.0168.7 ± 10.458.0 ± 13.620.1 ± 3.3

U13 (n = 38)12.6 ± 0.4613.1 ± 1.3156.7 ± 7.846.4 ± 13.618.7 ± 3.7
U14 (n = 61)13.5 ± 0.414.4 ± 1.1160.0 ± 8.447.9 ± 11.118.5 ± 3.0
U15 (n = 81)14.9 ± 0.715.9 ± 1.6169.4 ± 8.958.3 ± 11.320.2 ± 3.2
U16 (n = 31)15.4 ± 0.416.7 ± 1.4174.1 ± 7.658.8 ± 8.719.3 ± 1.9
U17 (n = 67)16.5 ± 0.417.6 ± 0.8174.3 ± 6.065.3 ± 8.921.5 ± 2.6
U18 (n = 52)17.5 ± 0.417.8 ± 0.8175.7 ± 8.567.6 ± 13.521.8 ± 3.3

QSL football (n = 346)25.9 ± 4.8N/A176.6 ± 6.972.3 ± 9.323.1 ± 2.1

Qatar Stars League footballers

The comparison adult data are drawn from a previously published study [4] which prospectively examined professional footballers in the Qatar Stars’ League over a 4-year period during annual pre-competition medical assessment. In year 2 of this study, all eligible players were tested on the NordBord Nordic hamstring testing device. After exclusion of the players who were injured or refused to consent to the testing, 346 players’ results were available for this analysis.

Data collection procedures and statistics

Eccentric knee flexor strength

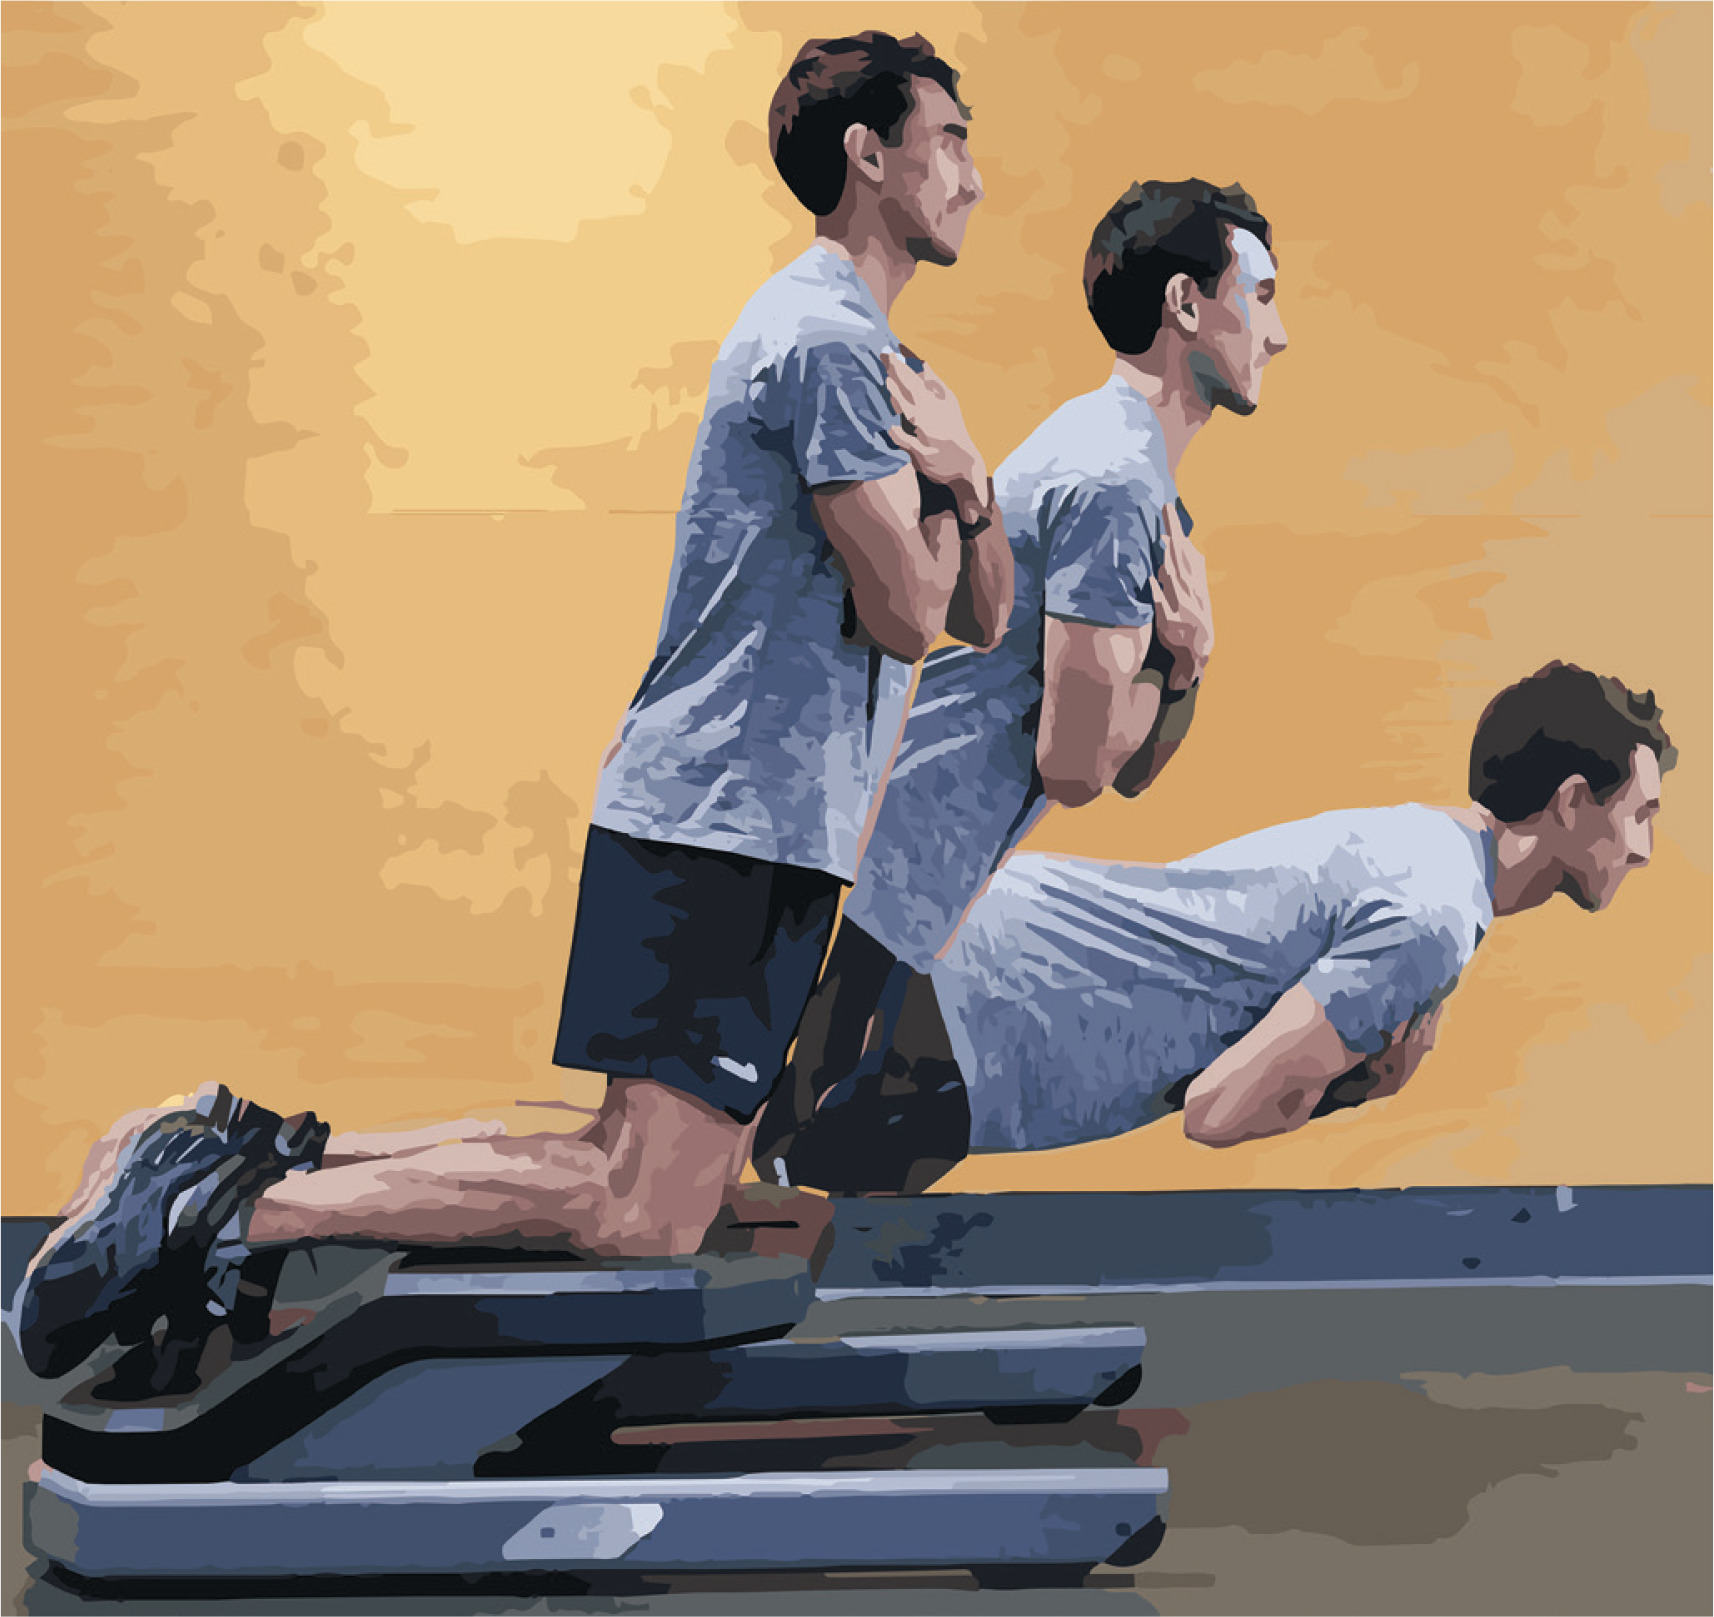
Athletes performed one set of three maximal repetitions on a device specifically designed to measure maximal force output (N) during the Nordic hamstring exercise [5] using previously described methods. The NordBord (Vald Performance, Australia) has been previously shown to have moderate to high reliability (intraclass correlation coefficient = 0.83–0.90; typical error, 21.7–27.5 N; typical error as a coefficient of variation, 5.8%-8.5%) [5]. Briefly, the athletes were first shown an instructional video and provided a handout in English and Arabic explaining the correct technique during the exercise. Each athlete was positioned kneeling on the device, the ankles secured by individual ankle braces immediately above the lateral malleoli. A submaximal effort was performed for familiarisation and to ensure correct performance. Participants were instructed to gradually lean forward at the slowest possible speed while maximally resisting the fall with both legs and maintaining an upright posture with their spine and pelvis in a neutral position. As the athlete lowered to the ground, uniaxial load cells attached to the ankle braces (Delphi Measurement, Gold Coast, Australia) measured the concomitant maximal force output (N). Each repetition was characterised by a distinct peak in maximum pull force followed by a sharp decline. This rapid reduction in force indicated completion of a repetition, whereby the athlete fails to maintain the resistance required to eccentrically lower their trunk position against the increasing demands of body mass, gravity, and the distance from the line of pull. Verbal encouragement was provided throughout the exercise to ensure maximal effort. The proprietary software provided instantaneous raw data that were then exported into a customised Microsoft Excel spreadsheet (Microsoft, Redmond, USA). The mean of the left and right maximum force (N) was taken to determine a between-limb absolute maximum strength score. An illustrated version of the Nordic hamstring exercise can be seen in Figure 2.

FIG. 2

Nordic hamstring exercise being performed on the NordBord and body mass (kg) for highly trained athletes in sports academy.

/f/fulltexts/BS/50251/JBS-40-50251-g002_min.jpg

Skeletal bone age and anthropometry

Skeletal maturation was assessed at the beginning of each academic year, using X-ray images of the athlete’s left hand and wrist complex taken at the Radiology Department at Aspetar Orthopaedic and Sports Medicine Hospital. The images were interpreted and entered into an academy maturation database by the same experienced assessor. Skeletal age was determined using the Fels method, following the procedures outlined by Roche et al. [6]; here a maximal skeletal age of 18.0 indicates full maturity. Anthropometric screenings were conducted by ISAK (International Society for the Advancement of Kinanthropometry) Level 2 certified academy staff at the start and end of each season, which corresponded to the academic year. Measures were taken early in the morning prior to any activities to minimize diurnal variations, following ISAK-recommended procedures, and were uploaded to a central academy anthropometry database, following the procedures previously described [7].

Data analysis

Absolute force data for the left and right limbs were entered in a spreadsheet (Microsoft Excel Microsoft, Redmond, USA) which calculated the average of both legs for the repetition where the highest force was displayed for each leg during the three contractions – the “mean peak force” (average of both limbs’ highest score). This value was recorded in both absolute terms (N) and relative to body mass (N/kg). Statistical analysis was conducted in JMP (JMP, Version 16.0 SAS Institute Inc., Cary, NC, 1989–2019). Mixed model regression analysis was conducted considering the fixed effects of sport (Football, Athletics, and Multi-sport) with chronological age group (U13 to U18), and the interaction effects of these two factors for the student athletes (considered as random effects), with post hoc adjustment for multiple comparison (Tukey’s HSD).

Ethical approval and consent

This study was part of a larger study on growth, maturation and athletic development for which written informed consent was obtained from the athletes’ guardians prior to data collection and ethics approval was granted from the Anti-Doping Lab Qatar Institutional Review Board (IRB Application #E20140000012). The adult data were collected as part of the routine pre-participation periodic health evaluation for football players participating in the Qatar Stars’ League and ethical approval for this cohort was obtained from the Shafallah Medical Genetics Centre (institutional review board project number 2012–020).

RESULTS

Student athlete Nordic hamstring strength – absolute and relative values for different age group categories and sports

These analyses were conducted for both absolute and relative Nordic hamstring strength. For absolute strength, a significant effect of age group was found (p < 0.001) and a non-significant effect of sport (p > 0.20). The interaction effect (sport and age group) was significant (p < 0.01). For the Nordic hamstring strength normalised to body mass, there was a significant effect of both chronological age (p = 0.004) and an interaction effect of sport and chronological age (p = 0.0014) whereas the effect of sport was not significant (p = 0.7112). Post hoc testing however revealed that of the possible 210 pair-wise comparisons (age group and sport), 21 were statistically significant after adjusting for multiple comparison (Tukey’s HSD), Appendix 5, Figure 4. Post hoc multiple comparison of the different student athlete age group categories for the relative Nordic hamstring strength revealed significant differences only for the comparison between the U13 years age group and the 15 years (difference = -1.0 N/kg [-1.7 to -0.2] p = 0.005), and the U13 to the U17 years age groups (difference = -1.1 N/kg [-1.9 to -0.3] p = 0.002). For each of these models, the residuals were analysed for normality by a combination of inspection of frequency histograms and residual quantile-quantile plots, and Shapiro-Wilk tests.

Nordic strength compared to chronological and skeletal age

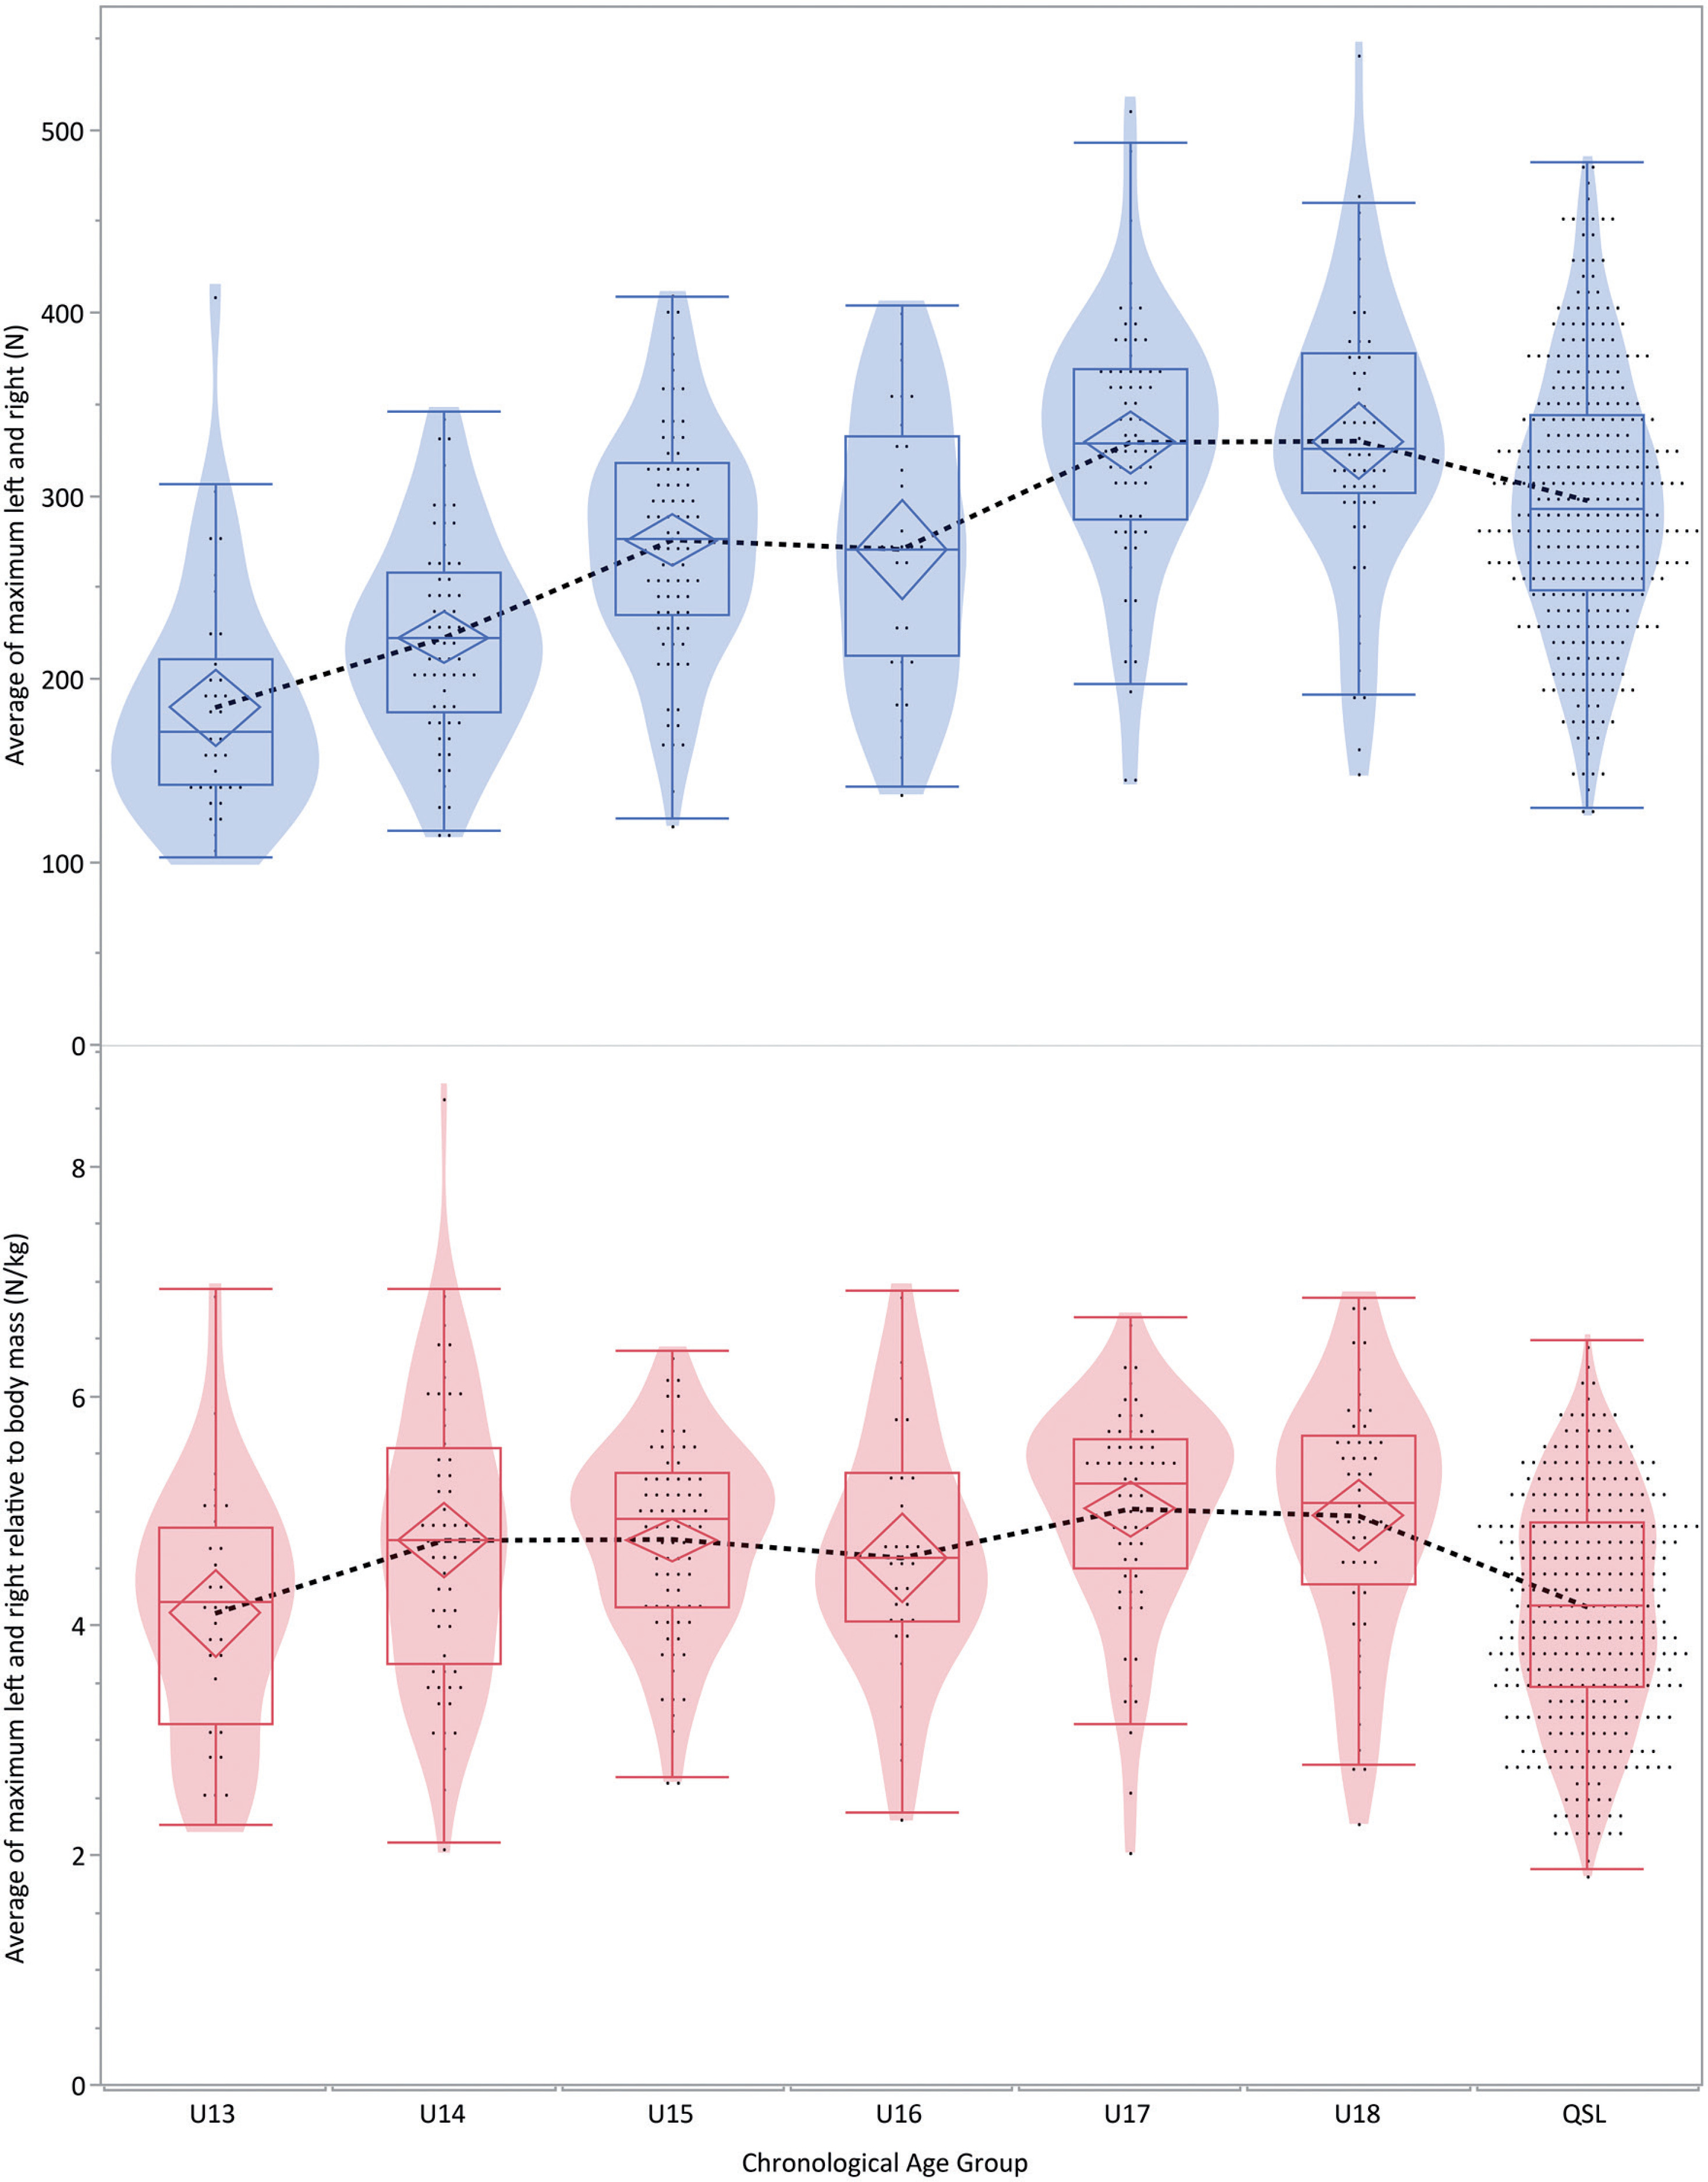
Figure 3 and Table 2 show the absolute and relative values of Nordic hamstring strength for the different age and sport categories respectively. Comparing the adult (Qatar Stars’ League players) to the student athlete age groups, significant differences were found for absolute strength with the U13, U14, U17, and U18 age categories (Figure 3, Appendix 1). By contrast, comparison of the normalised Nordic hamstring strength only showed significant differences for the 13 years age group compared to the 15 and 17 years’ categories (Figure 3, Appendix 2).

FIG. 3

Relative (N/kg) and absolute strength values for the different age groups. Note that the “QSL” category indicates all the Qatar Stars’ League players, and the U13 to U20 categories indicate the Aspire Academy student athletes’ age group categories. Confidence diamond within the boxplot describes the 95% confidence limit of the mean, contours represent the distribution of the individual points (dots) for each observation. Dotted line connects the mean values of the groups.

/f/fulltexts/BS/50251/JBS-40-50251-g003_min.jpg
TABLE 2

Absolute and relative strength values of the Nordic hamstring exercise by sports category

/f/fulltexts/BS/50251/JBS-40-50251-t002_min.jpg

Figures 4 and 5 show these same absolute and relative Nordic strength values compared to skeletal age and chronological age for the student athletes and QSL football players respectively.

FIG. 4

Absolute and relative Nordic hamstring strength values compared to skeletal age as estimated by the Fels method. There is a moderate positive (r = 0.65 [0.57 to 0.71]) significant (p < 0.0001) correlation between Fels skeletal age and absolute (N) strength, but only a weak positive (r = 0.18 [0.06 to 0.29]) significant (p = 0.003) correlation between relative strength (N/kg) and skeletal age.
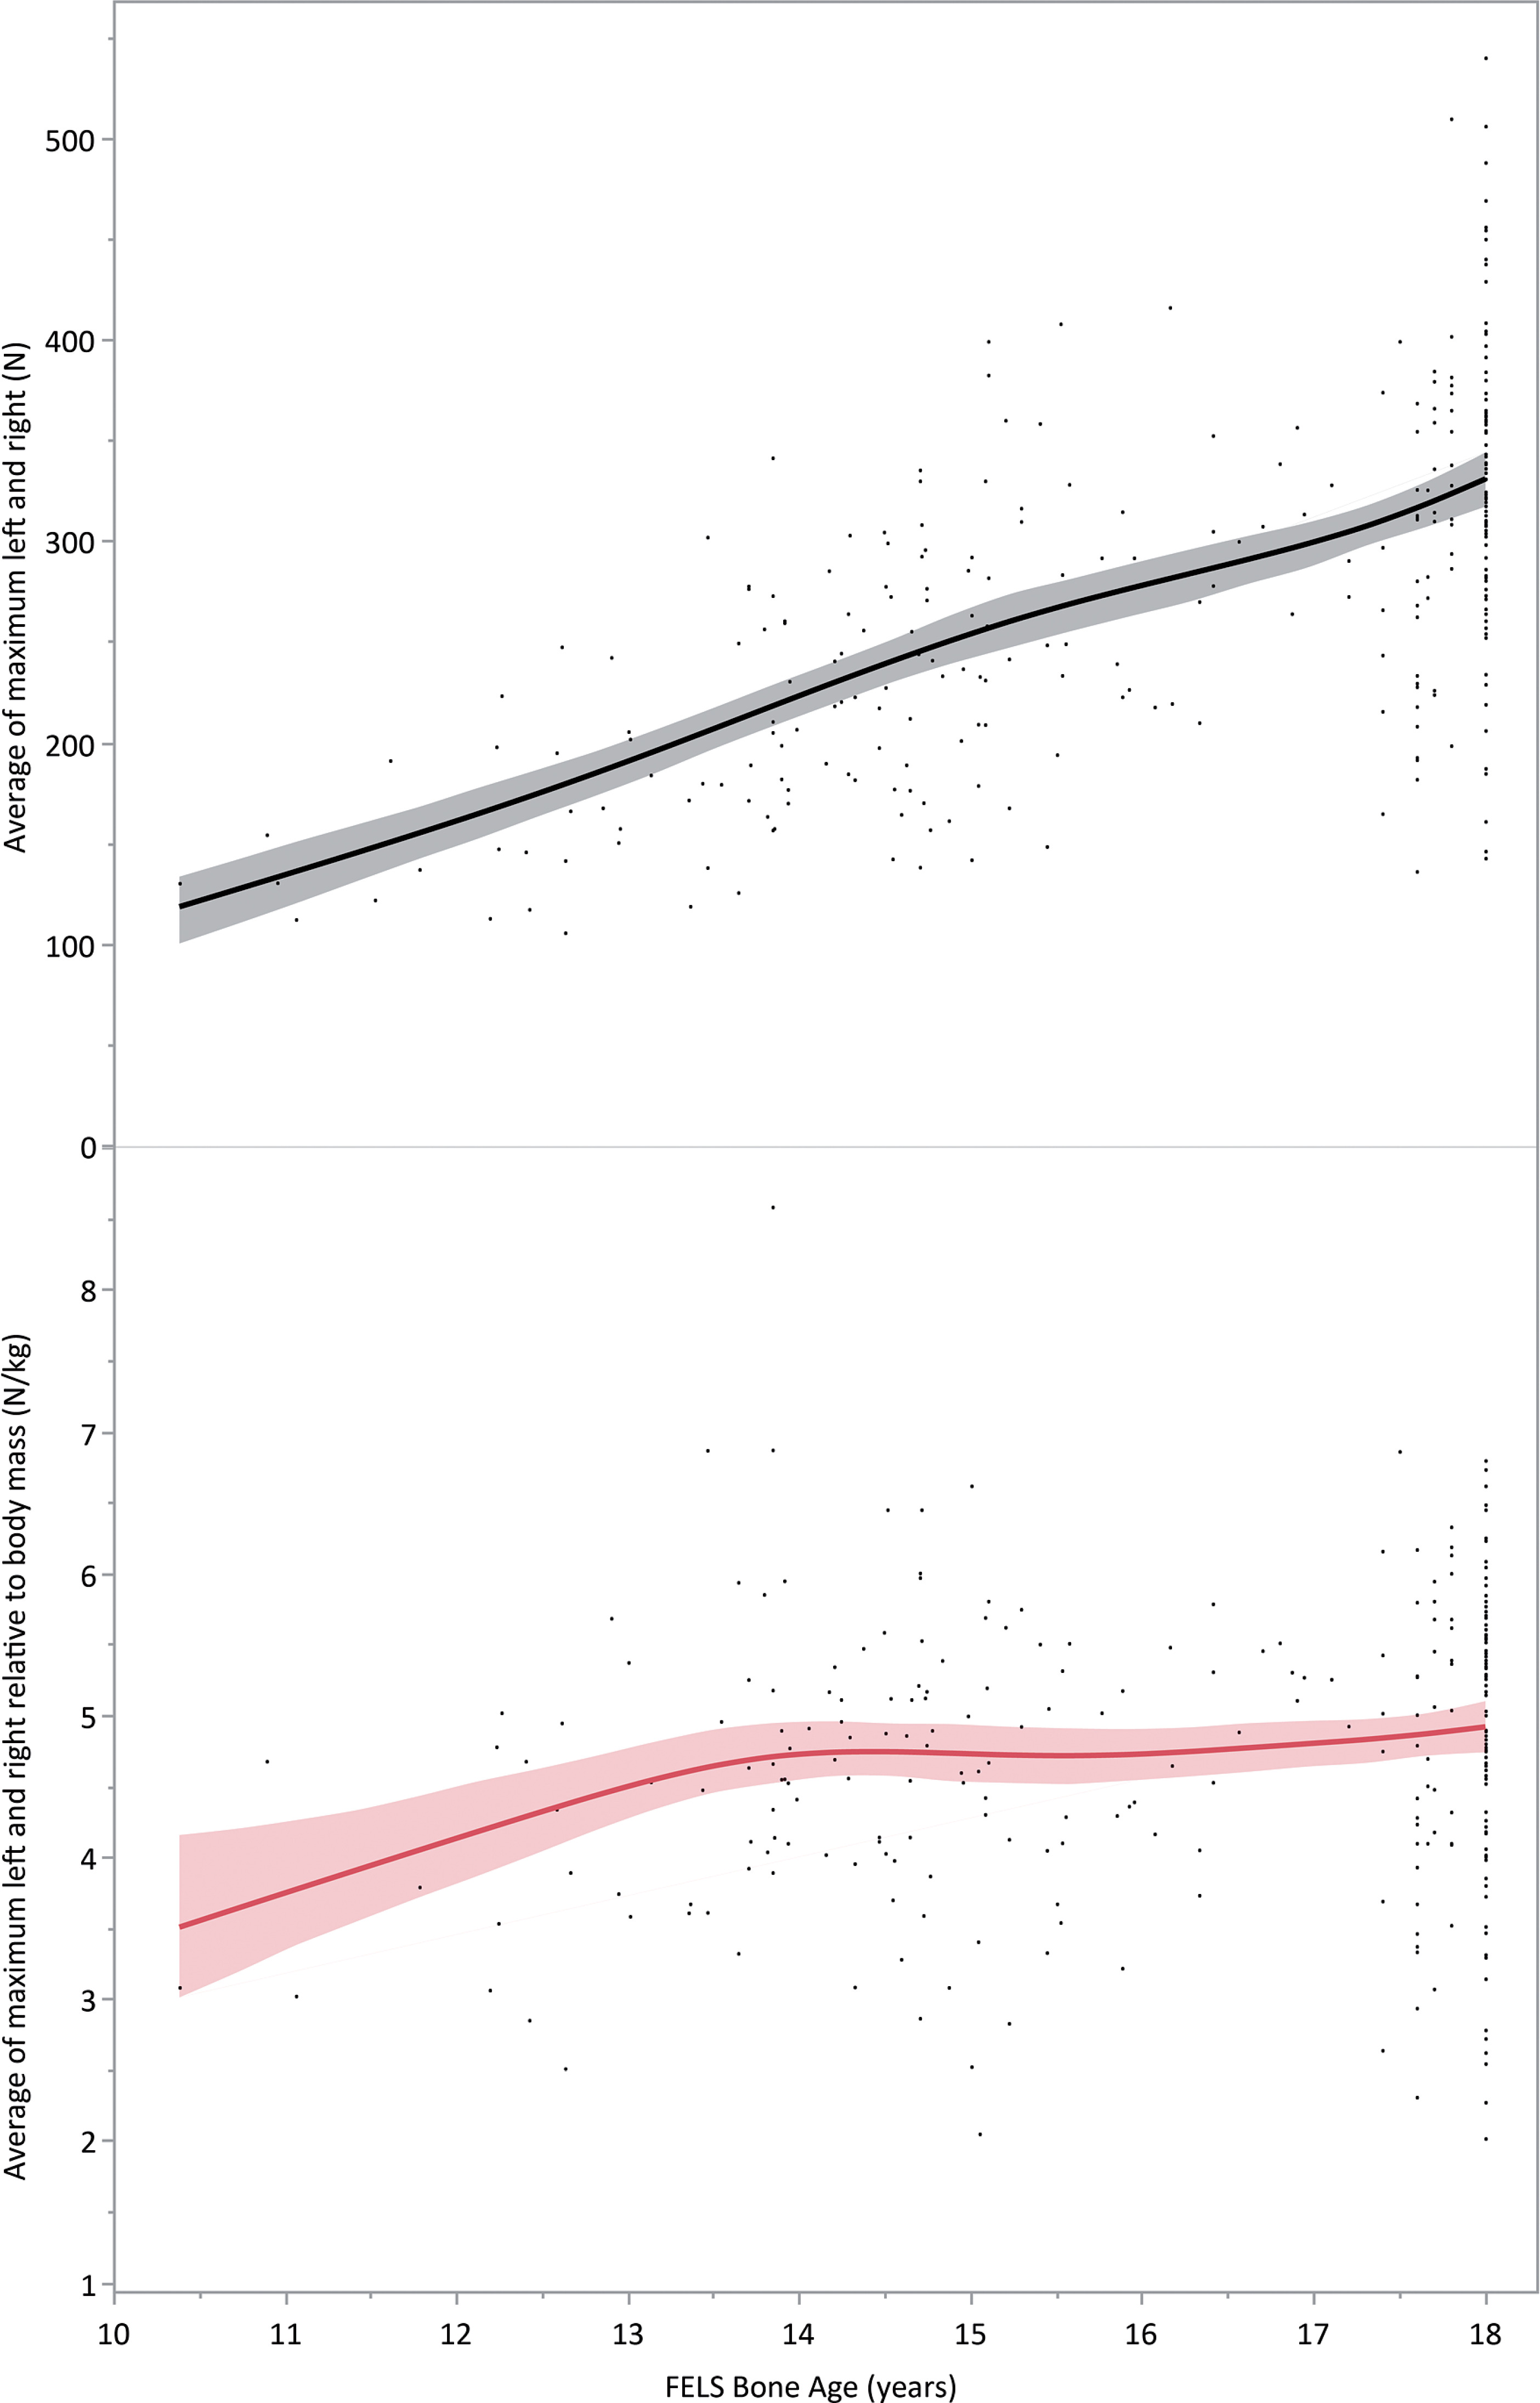
/f/fulltexts/BS/50251/JBS-40-50251-g004_min.jpg
FIG. 5

Absolute (N, upper panel) and relative (N/kg, lower panel) average maximum Nordic hamstring strength compared to age for both the student athletes (red diamonds, red line of best fit with confidence interval) and the QSL football players (blue circles, blue line). There is a moderate positive (r = 0.64 [0.57 to 0.70]) significant (p < 0.0001) correlation of absolute strength and age for the student athletes but not for the QSL footballers (r = 0.06 [-0.17 to 0.04], p = 0.2365). For the relative strengths, there is a weak positive (r = 0.25 [0.14 to 0.36]) significant (p < 0.0001) correlation for the student athletes, and a weak negative (r = -0.21 [-0.31 to -0.11)] significant (p < 0.0001) correlation for the QSL football players.

/f/fulltexts/BS/50251/JBS-40-50251-g005_min.jpg

DISCUSSION

This cross-sectional study of highly trained male youth athletes showed a clear pattern of increasing strength with chronological and skeletal age. However, the more important clinical finding is the more consistent relationship between body mass and maximum eccentric Nordic strength across these chronological and skeletal ages, particularly once these athletes were above the age of 13. This information can be used by physical preparation and rehabilitation practitioners as benchmarks for their adolescent male cohorts independent of their size and age. While this was a cross-sectional study, the stability of this finding across ages suggests that longitudinal progress needs to be assessed using the body mass-normalised values lest the apparent maturation effect be mistaken for relative improvement in strength.

These data suggest that clinicians should consider body mass as a critical factor in the interpretation of absolute eccentric hamstring strength. Increased body mass and/or longer lower leg lever distances can influence eccentric hamstring strength results during the Nordic exercise [8]. Specifically, heavier and older players have been shown to outperform their younger, lighter counterparts [8]. Body mass was found to be largely responsible for observed age-related increases in absolute Nordic hamstring strength [9]. A large body of evidence suggests that performing the Nordic hamstring exercise as part of a prevention programme is an effective way to reduce this injury’s burden [1]. These current data may complement this knowledge by providing practitioners with strength training targets for those adolescents beginning resistance training.

The student athletes’ average normative score was 4.74 N/kg (95% confidence interval: 4.64 to 4.86) whereas the QSL players’ average was 4.16 N/kg (4.06 to 4.27). Soccer players have been shown to achieve eccentric hamstring strength (N) scores of 4x body mass (kg) +26.1 N; for example a 50 kg athlete would have a predictive score of: 4 × 50 kg +26.1 = 226.1 N [8]. This value is comparable with the mean absolute strength of 277 N described in the current research. Roe et al. [10] examined eccentric knee flexor strength profiles of 341 elite Gaelic football players, 105 of whom were U17 or below, and found body mass to have moderate-to-large associations (r = 0.47) with maximum force in youth. In this study, relative maximum force was found to be 4.4 N/kg across all players. Bourne et al. [11] reported eccentric knee flexor strength in elite rugby union players of 3.65 ± 0.71 N/kg [11]. Further, they found subelite and U19 players to be significantly stronger than elite players, which is consistent with our cohort. Again, in uninjured elite Australian footballers, in-season relative eccentric hamstring strength scores were found to be 4.09 ± 1.01 N/kg [12]. Together these findings suggest that long-term tracking of these body mass normalised Nordic values can begin in early adolescence – we suggest after the age of 13 – and progress throughout an athlete’s career to adulthood; however, this would require verification with longitudinal studies.

Eccentric hamstring strength training in youth has been advocated as important in developing physical qualities that underpin performance and reduce injury risk [2, 9]. Furthermore, muscular strength in youth is strongly associated with a multitude of physical qualities including running speed, power, agility and endurance performance [13] Eccentric hamstring strength training complements the Youth Physical Development model to facilitate appropriate neural and structural adaptations [14, 15]. Despite the clinical indication for this exercise, performance and rehabilitation staff must consider the unique journey each athlete follows. It is important to recognise and embrace the inherent complexity and non-linearity of athlete development rather than age-related prescription-based methods [3]. The Nordic hamstring exercise in male youth footballers has been established as a reliable measure of bilateral hamstring peak force across maturation stages [16]. Individual differences in growth and maturation may contribute to competitive inequity and increased risk of injury [17]. Our findings highlight the fact that there are moderate associations between skeletal age and chronological age with eccentric hamstring strength in absolute terms but not when body mass is accounted for. Similarly, non-linear relationships between Nordic strength and age have been found in highly trained youth footballers [9]. Interestingly, abrupt changes were found in the U16 age group in absolute terms. This was ascribed to the pubertal growth spurt and accompanying increase in serum androgen hormones [9]. Drury et al. (2019) explored the influence of maturation status on eccentric hamstring strength improvements by implementing a 6-week Nordic hamstring exercise intervention study. Small and moderate increases (10% and 16%) in relative eccentric hamstring strength were observed in the pre-peak height velocity (PHV) and mid/post PHV groups respectively. Based on these findings, the authors suggest ingraining relative strength as a foundation for absolute strength in less mature individuals [2]. This considered, appropriate training relative to a child’s chosen activity, before and during maturation, enables combinatory and consolidatory factors that support motor skill performance during post-pubertal training years driven primarily via increases in testosterone, growth hormone and insulin-like growth factor [18]. Future research may consider the effect of hormonal as well as physical (i.e. body size) changes to tease out any individual effects.

Limitations and future research

Given the limited understanding of eccentric hamstring strength in youth sporting populations, further exploration is warranted particularly in other cohorts including youth female athletes and other ethnicities. In this cohort, the lever arm was not measured and may represent an extra independent variable to consider in youth athletes. The Nordic hamstring exercise requires a level of technical competence and a capacity to tolerate a high loading stimulus, which limits these findings to athletes who have been given appropriate technical instruction. The cross-sectional nature of this study prevents definitive statements about the longitudinal stability of these measures during maturation irrespective of the apparent stability of these data. Accordingly, long-term data examining individual variation are suggested for future research. Finally, while the performance of the Nordic hamstring exercise is associated with a reduction in hamstring injury in adults, there are essentially no similar data for adolescent athletes. Recommending the measurement of this strength in the absence of such data must be considered preliminary until this research is conducted.

CONCLUSIONS

Adolescent male athletes show increases in the absolute strength displayed during the Nordic hamstring exercise as chronological and especially skeletal age increases; however, when normalised to body mass these strengths are quite stable at approximately 4.7 N/kg once these adolescent boys were over the age of 13 years.

Acknowledgements

We gratefully acknowledge the student athletes who participated in this study, and the Aspire Academy for their logistic support.

Conflict of interest declaration

The authors declare no conflict of interest.

REFERENCES

1 

van Dyk N, Behan FP, Whiteley R. Including the Nordic hamstring exercise in injury prevention programmes halves the rate of hamstring injuries: a systematic review and meta-analysis of 8459 athletes. Br J Sports Med. 2019; 53(21):1362–70.

2 

Drury B, Ratel S, Clark CCT, Fernandes JFT, Moran J, Behm DG. Eccentric Resistance Training in Youth: Perspectives for Long-Term Athletic Development. J Funct Morphol Kinesiol. 2019; 4(4).

3 

Bergeron MF, Mountjoy M, Armstrong N, Chia M, Cote J, Emery CA, Faigenbaum A, Hall G, Jr., Kriemler S, Leglise M, Malina RM, Pensgaard AM, Sanchez A, Soligard T, Sundgot-Borgen J, van Mechelen W, Weissensteiner JR, Engebretsen L. International Olympic Committee consensus statement on youth athletic development. Br J Sports Med. 2015; 49(13):843–51.

4 

van Dyk N, Bahr R, Whiteley R, Tol JL, Kumar BD, Hamilton B, Farooq A, Witvrouw E. Hamstring and Quadriceps Isokinetic Strength Deficits Are Weak Risk Factors for Hamstring Strain Injuries: A 4-Year Cohort Study. Am J Sports Med. 2016; 44(7):1789–95.

5 

Opar DA, Piatkowski T, Williams MD, Shield AJ. A novel device using the Nordic hamstring exercise to assess eccentric knee flexor strength: a reliability and retrospective injury study. J Orthop Sports Phys Ther. 2013; 43(9):636–40.

6 

Roche AF, Thissen D, Chumlea W. Assessing the skeletal maturity of the hand-wrist: Fels method: Thomas; 1988.

7 

Wik EH, Martinez-Silvan D, Farooq A, Cardinale M, Johnson A, Bahr R. Skeletal maturation and growth rates are related to bone and growth plate injuries in adolescent athletics. Scand J Med Sci Sports. 2020; 30(5):894–903.

8 

Buchheit M, Cholley Y, Nagel M, Poulos N. The Effect of Body Mass on Eccentric Knee-Flexor Strength Assessed With an Instrumented Nordic Hamstring Device (Nordbord) in Football Players. Int J Sports Physiol Perform. 2016; 11(6):721–6.

9 

Markovic G, Sarabon N, Boban F, Zoric I, Jelcic M, Sos K, Scappaticci M. Nordic Hamstring Strength of Highly Trained Youth Football Players and Its Relation to Sprint Performance. J Strength Cond Res. 2020; 34(3):800–7.

10 

Roe M, Malone S, Delahunt E, Collins K, Gissane C, Persson UM, Murphy JC, Blake C. Eccentric knee flexor strength profiles of 341 elite male academy and senior Gaelic football players: Do body mass and previous hamstring injury impact performance? Phys Ther Sport. 2018; 31:68–74.

11 

Bourne MN, Opar DA, Williams MD, Shield AJ. Eccentric Knee Flexor Strength and Risk of Hamstring Injuries in Rugby Union: A Prospective Study. Am J Sports Med. 2015; 43(11):2663–70.

12 

Opar D, Drezner J, Shield A, Williams M, Webner D, Sennett B, Kapur R, Cohen M, Ulager J, Cafengiu A, Cronholm PF. Acute injuries in track and field athletes: a 3-year observational study at the Penn Relays Carnival with epidemiology and medical coverage implications. Am J Sports Med. 2015; 43(4):816–22.

13 

Lloyd RS, Faigenbaum AD, Stone MH, Oliver JL, Jeffreys I, Moody JA, Brewer C, Pierce KC, McCambridge TM, Howard R, Herrington L, Hainline B, Micheli LJ, Jaques R, Kraemer WJ, McBride MG, Best TM, Chu DA, Alvar BA, Myer GD. Position statement on youth resistance training: the 2014 International Consensus. Br J Sports Med. 2014; 48(7):498–505.

14 

Lloyd RS, Cronin JB, Faigenbaum AD, Haff GG, Howard R, Kraemer WJ, Micheli LJ, Myer GD, Oliver JL. National Strength and Conditioning Association Position Statement on Long-Term Athletic Development. J Strength Cond Res. 2016; 30(6):1491–509.

15 

Lloyd RS, Oliver JL. The youth physical development model: A new approach to long-term athletic development. Strength & Conditioning Journal. 2012; 34(3):61–72.

16 

Fernandes JFT, Moran J, Clarke H, Drury B. The influence of maturation on the reliability of the Nordic hamstring exercise in male youth footballers. Translational Sport Medicine. 2020; 3(2):148–53.

17 

Cumming SP, Lloyd RS, Oliver JL, Eisenmann JC, Malina RM. Bio-banding in sport: applications to competition, talent identification, and strength and conditioning of youth athletes. Strength & Conditioning Journal. 2017; 39(2):34–47.

18 

Malina RM. Top 10 research questions related to growth and maturation of relevance to physical activity, performance, and fitness. Res Q Exerc Sport. 2014; 85(2):157–73.

Appendices

APPENDIX 1

All pairwise comparisons of the different age groups for the absolute values of Nordic hamstring strength showing the mean, standard error of the difference, and the lower and upper 95% confidence limits. Significant (p < 0.05) differences are highlighted in red font (post hoc adjustment for multiple comparison using Tukey’s HSD)

Tukey HSD All Pairwise Comparisons

Quantile = 2.86867, Adjusted DF = 293.2, Adjustment = Tukey-Kramer

All Pairwise Differences

Chronological Age GroupChronological Age GroupDifferenceStd Errort RatioProb > |t|Lower 95%Upper 95%
U13U14-39.81219.88504-2.000.3436-96.85617.2314
U13U15-92.80718.79877-4.94< .0001*-146.734-38.8792
U13U16-109.49922.59550-4.85< .0001*-174.318-44.6797
U13U17-143.10019.20479-7.45< .0001*-198.192-88.0076
U13U18-152.55421.16543-7.21< .0001*-213.271-91.8375
U14U15-52.99412.21499-4.340.0003*-88.035-17.9536
U14U16-69.68617.92088-3.890.0017*-121.096-18.2774
U14U17-103.28813.51347-7.64< .0001*-142.053-64.5219
U14U18-112.74216.18616-6.97< .0001*-159.175-66.3091
U15U16-16.69215.69550-1.060.8954-61.71728.3332
U15U17-50.29311.08316-4.540.0001*-82.087-18.4992
U15U18-59.74714.33989-4.170.0006*-100.884-18.6110
U16U17-33.60115.97462-2.100.2884-79.42712.2249
U16U18-43.05519.03310-2.260.2131-97.65511.5443
U17U18-9.45414.40274-0.660.9864-50.77131.8624
APPENDIX 2

All pairwise comparisons of the different age groups for the relative values of Nordic hamstring strength showing the mean, standard error of the difference, and the lower and upper 95% confidence limits. Significant (p < 0.05) differences are highlighted in red font (post hoc adjustment for multiple comparison using Tukey’s HSD)

Tukey HSD All Pairwise Comparisons

Quantile = 2.86946, Adjusted DF = 281.5, Adjustment = Tukey-Kramer

All Pairwise Differences

Chronological Age GroupChronological Age GroupDifferenceStd Errort RatioProb > |t|Lower 95%Upper 95%
U13U14-0.832610.2953740-2.820.0574-1.680180.01495
U13U15-1.000240.2781175-3.600.0051*-1.79828-0.20219
U13U16-1.012000.3695513-2.740.0710-2.072410.04841
U13U17-1.102950.2864349-3.850.0020*-1.92487-0.28104
U13U18-0.845180.3121202-2.710.0768-1.740800.05044
U14U15-0.167630.1903528-0.880.9509-0.713840.37858
U14U16-0.179390.3119213-0.580.9926-1.074440.71566
U14U17-0.270340.2072105-1.300.7823-0.864930.32424
U14U18-0.012570.2413914-0.051.0000-0.705230.68010
U15U16-0.011760.2884429-0.041.0000-0.839440.81591
U15U17-0.102720.1753471-0.590.9919-0.605870.40043
U15U180.155060.21570320.720.9795-0.463890.77401
U16U17-0.090950.2947299-0.310.9996-0.936670.75476
U16U180.166820.32573760.510.9957-0.767871.10151
U17U180.257780.22239611.160.8558-0.380380.89593
APPENDIX 3

All pairwise comparisons for the different skeletal age groups for the student athletes for absolute Nordic hamstring strength. Significant differences are noted in the column “Prob > |t|” with an asterisk and a coloured font.

FELS Bone Age GroupFELS Bone Age GroupDifferenceStd Errort RatioProb > |t|Lower 95%Upper 95%
1011-2.18849.29283-0.041.0000-156.243151.868
1012-29.53340.81834-0.720.9984-157.10398.037
1013-64.22939.08058-1.640.7799-186.36857.910
1014-96.33838.51122-2.500.2355-216.69824.021
1015-129.48638.82598-3.340.0265*-250.829-8.142
1016-157.93841.06059-3.850.0046*-286.265-29.610
1017-160.31838.26461-4.190.0012*-279.907-40.729
1018-193.30337.81667-5.11< .0001*-311.491-75.114
1112-27.34636.31838-0.750.9979-140.85286.160
1113-62.04234.35375-1.810.6783-169.40845.324
1114-94.15133.70463-2.790.1218-199.48811.187
1115-127.29834.06384-3.740.0068*-233.758-20.838
1116-155.75036.59043-4.260.0009*-270.106-41.394
1117-158.13133.42258-4.730.0001*-262.587-53.675
1118-191.11532.90880-5.81< .0001*-293.965-88.265
1213-34.69620.40917-1.700.7462-98.48129.089
1214-66.80519.29654-3.460.0176*-127.112-6.497
1215-99.95219.91731-5.02< .0001*-162.200-37.705
1216-128.40423.98362-5.35< .0001*-203.360-53.448
1217-130.78518.79955-6.96< .0001*-189.539-72.030
1218-163.76917.87017-9.16< .0001*-219.619-107.919
1314-32.10915.28109-2.100.4745-79.86715.649
1315-65.25716.05785-4.060.0020*-115.442-15.071
1316-93.70820.88945-4.490.0004*-158.994-28.422
1317-96.08914.64849-6.56< .0001*-141.870-50.308
1318-129.07313.43496-9.61< .0001*-171.062-87.085
1415-33.14814.61768-2.270.3654-78.83212.537
1416-61.59919.80382-3.110.0522-123.4930.294
1417-63.98013.05375-4.90< .0001*-104.777-23.183
1418-96.96411.67563-8.30< .0001*-133.454-60.474
1516-28.45220.40917-1.390.8995-92.23735.333
1517-30.83213.95504-2.210.4023-74.44612.781
1518-63.81712.67530-5.03< .0001*-103.431-24.203
1617-2.38119.31988-0.121.0000-62.76158.000
1618-35.36518.41678-1.920.6003-92.92322.193
1718-32.98410.83452-3.040.0629-66.8460.877
APPENDIX 4

All pairwise comparisons of relative Nordic hamstring strength for the different skeletal age groups. No significant differences were found for any between-group comparisons.

FELS Bone Age GroupFELS Bone Age GroupDifferenceStd Errort RatioProb > |t|Lower 95%Upper 95%
10110.473350.96870620.490.9999-2.555673.502366
1012-0.206490.7398616-0.281.0000-2.519942.106965
1013-0.767560.7074430-1.080.9760-2.979651.444518
1014-0.820320.7007274-1.170.9620-3.011401.370768
1015-0.607210.7054303-0.860.9947-2.813001.598585
1016-1.065310.7322731-1.450.8751-3.355031.224416
1017-0.866700.6980271-1.240.9464-3.049341.315940
1018-0.993270.6922274-1.430.8834-3.157771.171239
1112-0.679830.7398616-0.920.9918-2.993281.633619
1113-1.240910.7074430-1.750.7122-3.452990.971173
1114-1.293660.7007274-1.850.6512-3.484750.897422
1115-1.080550.7054303-1.530.8397-3.286341.125239
1116-1.538650.7322731-2.100.4747-3.828380.751070
1117-1.340050.6980271-1.920.6007-3.522690.842595
1118-1.466610.6922274-2.120.4628-3.631120.697893
1213-0.561080.3308762-1.700.7488-1.595690.473529
1214-0.613830.3162631-1.940.5860-1.602740.375084
1215-0.400720.3265508-1.230.9499-1.421800.620364
1216-0.858820.3810870-2.250.3743-2.050430.332789
1217-0.660210.3102343-2.130.4564-1.630280.309849
1218-0.786780.2969549-2.650.1715-1.715320.141759
1314-0.052750.2304404-0.231.0000-0.773310.667806
13150.160360.24436820.660.9992-0.603750.924468
1316-0.297740.3135406-0.950.9898-1.278140.682658
1317-0.099140.2220939-0.451.0000-0.793590.595323
1318-0.225700.2031320-1.110.9722-0.860870.409465
14150.213110.22418560.950.9897-0.487890.914111
1416-0.244990.2980789-0.820.9961-1.177050.687063
1417-0.046380.1996724-0.231.0000-0.670730.577966
1418-0.172950.1783422-0.970.9883-0.730600.384703
1516-0.458100.3089726-1.480.8628-1.424220.508015
1517-0.259500.2155971-1.200.9552-0.933640.414649
1518-0.386060.1960077-1.970.5659-0.998950.226829
16170.198610.29167440.680.9990-0.713421.110636
16180.072040.27750830.261.0000-0.795690.939774
1718-0.126570.1674183-0.760.9979-0.650060.396929
APPENDIX 5

All pairwise comparisons of relative Nordic hamstring strength for the student athletes – age and sport, with post-hoc adjustment (Tukey HSD) for multiple comparison. Significant effects are highlighted in the Prob > |t| column with an asterisk and coloured font.

Tukey HSD All Pairwise Comparisons

Quantile = 3.52198, Adjusted DF = 278.9, Adjustment = Tukey-Kramer

All Pairwise Differences

SPORT 2Chronological Age GroupSPORT 2Chronological Age GroupDifferenceStd Errort RatioProb > |t|Lower 95%Upper 95%
AthleticsU13AthleticsU14-0.014620.4174617-0.041.0000-1.484911.45568
AthleticsU13AthleticsU15-0.695000.3555572-1.950.8876-1.947270.55726
AthleticsU13AthleticsU16-0.673310.3574688-1.880.9156-1.932310.58569
AthleticsU13AthleticsU17-1.368400.3529221-3.880.0153*-2.61139-0.12542
AthleticsU13AthleticsU18-1.547230.3693259-4.190.0048*-2.84799-0.24647
AthleticsU13FootballU13-0.837130.3607736-2.320.6678-2.107770.43351
AthleticsU13FootballU14-1.185200.3344155-3.540.0467*-2.36300-0.00739
AthleticsU13FootballU15-1.271680.3332591-3.820.0190*-2.44541-0.09794
AthleticsU13FootballU16-0.413660.7029482-0.591.0000-2.889432.06211
AthleticsU13FootballU17-1.389000.3461831-4.010.0094*-2.60825-0.16975
AthleticsU13FootballU18-1.300460.3497937-3.720.0265*-2.53243-0.06849
AthleticsU13Multi-sportU131.095180.72963581.500.9900-1.474593.66494
AthleticsU13Multi-sportU14-1.039980.4496943-2.310.6735-2.623790.54384
AthleticsU13Multi-sportU15-0.775990.3889837-1.990.8694-2.145980.59400
AthleticsU13Multi-sportU16-1.690990.5473588-3.090.1676-3.618780.23680
AthleticsU13Multi-sportU17-0.293420.4317714-0.681.0000-1.814111.22728
AthleticsU13Multi-sportU180.570200.55726851.020.9999-1.392492.53289
AthleticsU14AthleticsU15-0.680390.3346714-2.030.8506-1.859090.49832
AthleticsU14AthleticsU16-0.658690.3512654-1.880.9186-1.895840.57846
AthleticsU14AthleticsU17-1.353790.3482578-3.890.0148*-2.58034-0.12723
AthleticsU14AthleticsU18-1.532620.3649971-4.200.0046*-2.81813-0.24710
AthleticsU14FootballU13-0.822520.3563366-2.310.6767-2.077530.43249
AthleticsU14FootballU14-1.170580.3296238-3.550.0456*-2.33151-0.00965
AthleticsU14FootballU15-1.257060.3284506-3.830.0182*-2.41386-0.10026
AthleticsU14FootballU16-0.399040.7006813-0.571.0000-2.866832.06875
AthleticsU14FootballU17-1.374390.3415566-4.020.0090*-2.57734-0.17143
AthleticsU14FootballU18-1.285840.3452156-3.720.0259*-2.50169-0.07000
AthleticsU14Multi-sportU131.109790.72745211.530.9881-1.452283.67187
AthleticsU14Multi-sportU14-1.025360.4461425-2.300.6839-2.596670.54594
AthleticsU14Multi-sportU15-0.761370.3848720-1.980.8771-2.116890.59414
AthleticsU14Multi-sportU16-1.676370.5444445-3.080.1719-3.593900.24115
AthleticsU14Multi-sportU17-0.278800.4280709-0.651.0000-1.786461.22886
AthleticsU14Multi-sportU180.584820.55440631.050.9999-1.367792.53743
AthleticsU15AthleticsU160.021690.25844070.081.0000-0.888530.93192
AthleticsU15AthleticsU17-0.673400.2691777-2.500.5311-1.621440.27464
AthleticsU15AthleticsU18-0.852230.2919248-2.920.2489-1.880390.17592
AthleticsU15FootballU13-0.142130.2812871-0.511.0000-1.132820.84856
AthleticsU15FootballU14-0.490190.2465735-1.990.8726-1.358620.37823
AthleticsU15FootballU15-0.576670.2450029-2.350.6432-1.439570.28622
AthleticsU15FootballU160.281340.66565830.421.0000-2.063092.62578
AthleticsU15FootballU17-0.694000.2623119-2.650.4239-1.617860.22986
AthleticsU15FootballU18-0.605460.2670588-2.270.7061-1.546030.33512
AthleticsU15Multi-sportU131.790180.69378182.580.4718-0.653314.23367
AthleticsU15Multi-sportU14-0.344980.3888313-0.891.0000-1.714431.02448
AthleticsU15Multi-sportU15-0.080990.3166593-0.261.0000-1.196261.03428
AthleticsU15Multi-sportU16-0.995990.4985644-2.000.8680-2.751920.75995
AthleticsU15Multi-sportU170.401590.36795561.090.9998-0.894351.69752
AthleticsU15Multi-sportU181.265200.50942422.480.5449-0.528983.05939
AthleticsU16AthleticsU17-0.695090.2547918-2.730.3662-1.592460.20228
AthleticsU16AthleticsU18-0.873920.2912006-3.000.2070-1.899530.15168
AthleticsU16FootballU13-0.163820.2836996-0.581.0000-1.163010.83536
AthleticsU16FootballU14-0.511890.2493221-2.050.8401-1.390000.36622
AthleticsU16FootballU15-0.598370.2477690-2.420.5971-1.471000.27427
AthleticsU16FootballU160.259650.66668130.391.0000-2.088392.60769
AthleticsU16FootballU17-0.715690.2648973-2.700.3843-1.648660.21727
AthleticsU16FootballU18-0.627150.2695987-2.330.6635-1.576670.32237
AthleticsU16Multi-sportU131.768490.69476342.550.4980-0.678464.21543
AthleticsU16Multi-sportU14-0.366670.3905801-0.941.0000-1.742281.00895
AthleticsU16Multi-sportU15-0.102680.3188042-0.321.0000-1.225501.02014
AthleticsU16Multi-sportU16-1.017680.4999295-2.040.8492-2.778420.74306
AthleticsU16Multi-sportU170.379890.36980311.030.9999-0.922551.68233
AthleticsU16Multi-sportU181.243510.51076022.430.5822-0.555383.04240
AthleticsU17AthleticsU18-0.178830.2586926-0.691.0000-1.089940.73228
AthleticsU17FootballU130.531270.27794871.910.9053-0.447661.51020
AthleticsU17FootballU140.183210.24275830.751.0000-0.671781.03820
AthleticsU17FootballU150.096730.24116290.401.0000-0.752640.94610
AthleticsU17FootballU160.954740.66425451.440.9938-1.384753.29424
AthleticsU17FootballU17-0.020600.2587289-0.081.0000-0.931840.89064
AthleticsU17FootballU180.067940.26354030.261.0000-0.860240.99613
AthleticsU17Multi-sportU132.463580.69243503.560.0447*0.024834.90232
AthleticsU17Multi-sportU140.328420.38642310.851.0000-1.032551.68940
AthleticsU17Multi-sportU150.592410.31369761.890.9139-0.512431.69725
AthleticsU17Multi-sportU16-0.322590.4966886-0.651.0000-2.071921.42674
AthleticsU17Multi-sportU171.074990.36540992.940.2369-0.211982.36195
AthleticsU17Multi-sportU181.938600.50758853.820.0188*0.150883.72632
AthleticsU18FootballU130.710100.29850142.380.6244-0.341221.76142
AthleticsU18FootballU140.362040.26604361.360.9967-0.574961.29904
AthleticsU18FootballU150.275560.26458861.040.9999-0.656321.20743
AthleticsU18FootballU161.133570.67311341.680.9682-1.237123.50427
AthleticsU18FootballU170.158230.28069240.561.0000-0.830361.14683
AthleticsU18FootballU180.246780.28513350.871.0000-0.757461.25101
AthleticsU18Multi-sportU132.642410.70093783.770.0222*0.173725.11110
AthleticsU18Multi-sportU140.507260.40146041.260.9986-0.906681.92119
AthleticsU18Multi-sportU150.771240.33204492.320.6661-0.398211.94070
AthleticsU18Multi-sportU16-0.143760.5084753-0.281.0000-1.934601.64709
AthleticsU18Multi-sportU171.253820.38127683.290.0994-0.089032.59667
AthleticsU18Multi-sportU182.117430.51912784.080.0073*0.289083.94579
FootballU13FootballU14-0.348060.2319494-1.500.9900-1.164980.46886
FootballU13FootballU15-0.434540.2519972-1.720.9604-1.322070.45299
FootballU13FootballU160.423470.66844250.631.0000-1.930772.77772
FootballU13FootballU17-0.551870.2692804-2.050.8420-1.500270.39653
FootballU13FootballU18-0.463330.2736955-1.690.9666-1.427280.50063
FootballU13Multi-sportU131.932310.69646962.770.3355-0.520644.38526
FootballU13Multi-sportU14-0.202840.3936070-0.521.0000-1.589121.18343
FootballU13Multi-sportU150.061140.32250550.191.0000-1.074721.19700
FootballU13Multi-sportU16-0.853860.5022979-1.700.9653-2.622940.91523
FootballU13Multi-sportU170.543720.37299871.460.9927-0.769981.85741
FootballU13Multi-sportU181.407330.51307872.740.3563-0.399723.21439
FootballU14FootballU15-0.086480.2098376-0.411.0000-0.825520.65257
FootballU14FootballU160.771540.65446131.180.9994-1.533463.07654
FootballU14FootballU17-0.203810.2322766-0.881.0000-1.021880.61427
FootballU14FootballU18-0.115260.2364071-0.491.0000-0.947880.71736
FootballU14Multi-sportU132.280370.68318813.340.0865-0.125804.68655
FootballU14Multi-sportU140.145220.36959780.391.0000-1.156501.44694
FootballU14Multi-sportU150.409210.29272151.400.9954-0.621751.44017
FootballU14Multi-sportU16-0.505790.4837140-1.050.9999-2.209431.19784
FootballU14Multi-sportU170.891780.34756892.570.4827-0.332352.11591
FootballU14Multi-sportU181.755400.49489983.550.0462*0.012373.49843
FootballU15FootballU160.858020.64814931.320.9976-1.424753.14079
FootballU15FootballU17-0.117330.2106229-0.561.0000-0.859140.62448
FootballU15FootballU18-0.028780.2216538-0.131.0000-0.809440.75188
FootballU15Multi-sportU132.366850.68262283.470.0591-0.037334.77104
FootballU15Multi-sportU140.231700.36855190.631.0000-1.066341.52973
FootballU15Multi-sportU150.495680.29139981.700.9651-0.530621.52199
FootballU15Multi-sportU16-0.419310.4829153-0.871.0000-2.120131.28151
FootballU15Multi-sportU170.978260.34645642.820.3044-0.241952.19847
FootballU15Multi-sportU181.841880.49411913.730.0257*0.101603.58216
FootballU16FootballU17-0.975340.6529113-1.490.9905-3.274891.32420
FootballU16FootballU18-0.886800.6614025-1.340.9972-3.216251.44265
FootballU16Multi-sportU131.508840.92143821.640.9757-1.736454.75413
FootballU16Multi-sportU14-0.626320.7203506-0.871.0000-3.163381.91074
FootballU16Multi-sportU15-0.362330.6840967-0.531.0000-2.771712.04705
FootballU16Multi-sportU16-1.277330.7850361-1.630.9771-4.042211.48755
FootballU16Multi-sportU170.120240.70930010.171.0000-2.377902.61839
FootballU16Multi-sportU180.983860.79197741.240.9989-1.805473.77319
FootballU17FootballU180.088540.24228060.371.0000-0.764760.94185
FootballU17Multi-sportU132.484180.68902473.610.0384*0.057454.91091
FootballU17Multi-sportU140.349020.38027830.921.0000-0.990311.68836
FootballU17Multi-sportU150.613010.30609632.000.8657-0.465051.69108
FootballU17Multi-sportU16-0.301990.4919230-0.611.0000-2.034531.43056
FootballU17Multi-sportU171.095590.35890553.050.1833-0.168472.35964
FootballU17Multi-sportU181.959200.50292633.900.0143*0.187913.73050
FootballU18Multi-sportU132.395640.69084573.470.0591-0.037514.82878
FootballU18Multi-sportU140.260480.38356810.681.0000-1.090441.61140
FootballU18Multi-sportU150.524470.31017381.690.9670-0.567961.61690
FootballU18Multi-sportU16-0.390530.4944706-0.791.0000-2.132051.35099
FootballU18Multi-sportU171.007040.36238932.780.3326-0.269292.28337
FootballU18Multi-sportU181.870660.50541833.700.0281*0.090583.65073
Multi-sportU13Multi-sportU14-2.135150.7464162-2.860.2822-4.764020.49371
Multi-sportU13Multi-sportU15-1.871170.7114918-2.630.4353-4.377030.63469
Multi-sportU13Multi-sportU16-2.786170.8090203-3.440.0635-5.635520.06319
Multi-sportU13Multi-sportU17-1.388590.7357573-1.890.9143-3.979921.20273
Multi-sportU13Multi-sportU18-0.524980.8157576-0.641.0000-3.398062.34811
Multi-sportU14Multi-sportU150.263990.41239670.641.0000-1.188471.71644
Multi-sportU14Multi-sportU16-0.651010.5691634-1.140.9996-2.655601.35357
Multi-sportU14Multi-sportU170.746560.45955391.620.9775-0.871982.36510
Multi-sportU14Multi-sportU181.610180.57906572.780.3315-0.429283.64964
Multi-sportU15Multi-sportU16-0.915000.5117659-1.790.9454-2.717430.88743
Multi-sportU15Multi-sportU170.482570.39987591.210.9992-0.925781.89093
Multi-sportU15Multi-sportU181.346190.53329202.520.5140-0.532053.22444
Multi-sportU16Multi-sportU171.397570.53905432.590.4627-0.500973.29611
Multi-sportU16Multi-sportU182.261190.65779463.440.0647-0.055554.57793
Multi-sportU17Multi-sportU180.863620.56525981.530.9879-1.127222.85445
Copyright: Institute of Sport. This is an Open Access article distributed under the terms of the Creative Commons CC BY License (https://creativecommons.org/licenses/by/4.0/). This license enables reusers to distribute, remix, adapt, and build upon the material in any medium or format, so long as attribution is given to the creator. The license allows for commercial use.
 
Quick links
© 2024 Termedia Sp. z o.o.
Developed by Bentus.